Fig. 7
Download original image
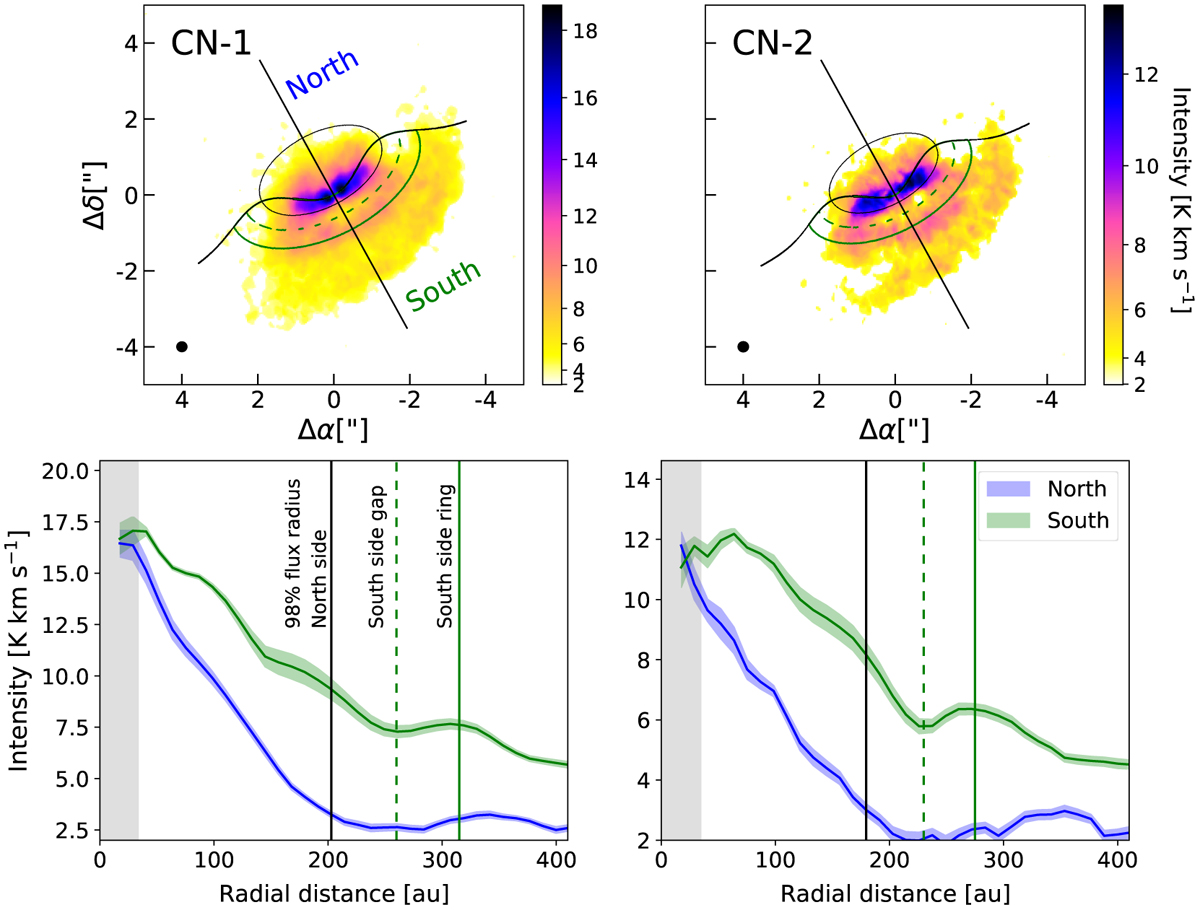
Azimuthal and radial analysis of the CN emission. Top row: integrated intensity of each CN transition. The minor and major axis are marked considering the exponentially tapered vertical profile of the disk. The black elliptical contour marks the north quadrant's 98% flux radius, derived from the intensity profile analysis. The north and south regions are shown in the colors that are used for the intensity radial profiles. The dashed and continuous green contours, respectively indicate the location of the gap and ring detected in the south side emission. Bottom row: intensity profiles derived from the integrated intensity map of each transition. The blue curve traces the north side emission and the green curve the south side emission. The vertical black lines show the location of the north emission 98% flux radius. The vertical green lines show the location of the identified gap (dashed) and ring (solid) in the south side emission. The gray vertical shaded area indicates a one-beam distance from the center. The colored shaded regions show the uncertainty of the intensity profile within each radial bin, obtained as the standard deviation of the data over the number of beams within the radial bin.
Current usage metrics show cumulative count of Article Views (full-text article views including HTML views, PDF and ePub downloads, according to the available data) and Abstracts Views on Vision4Press platform.
Data correspond to usage on the plateform after 2015. The current usage metrics is available 48-96 hours after online publication and is updated daily on week days.
Initial download of the metrics may take a while.