Fig. 6
Download original image
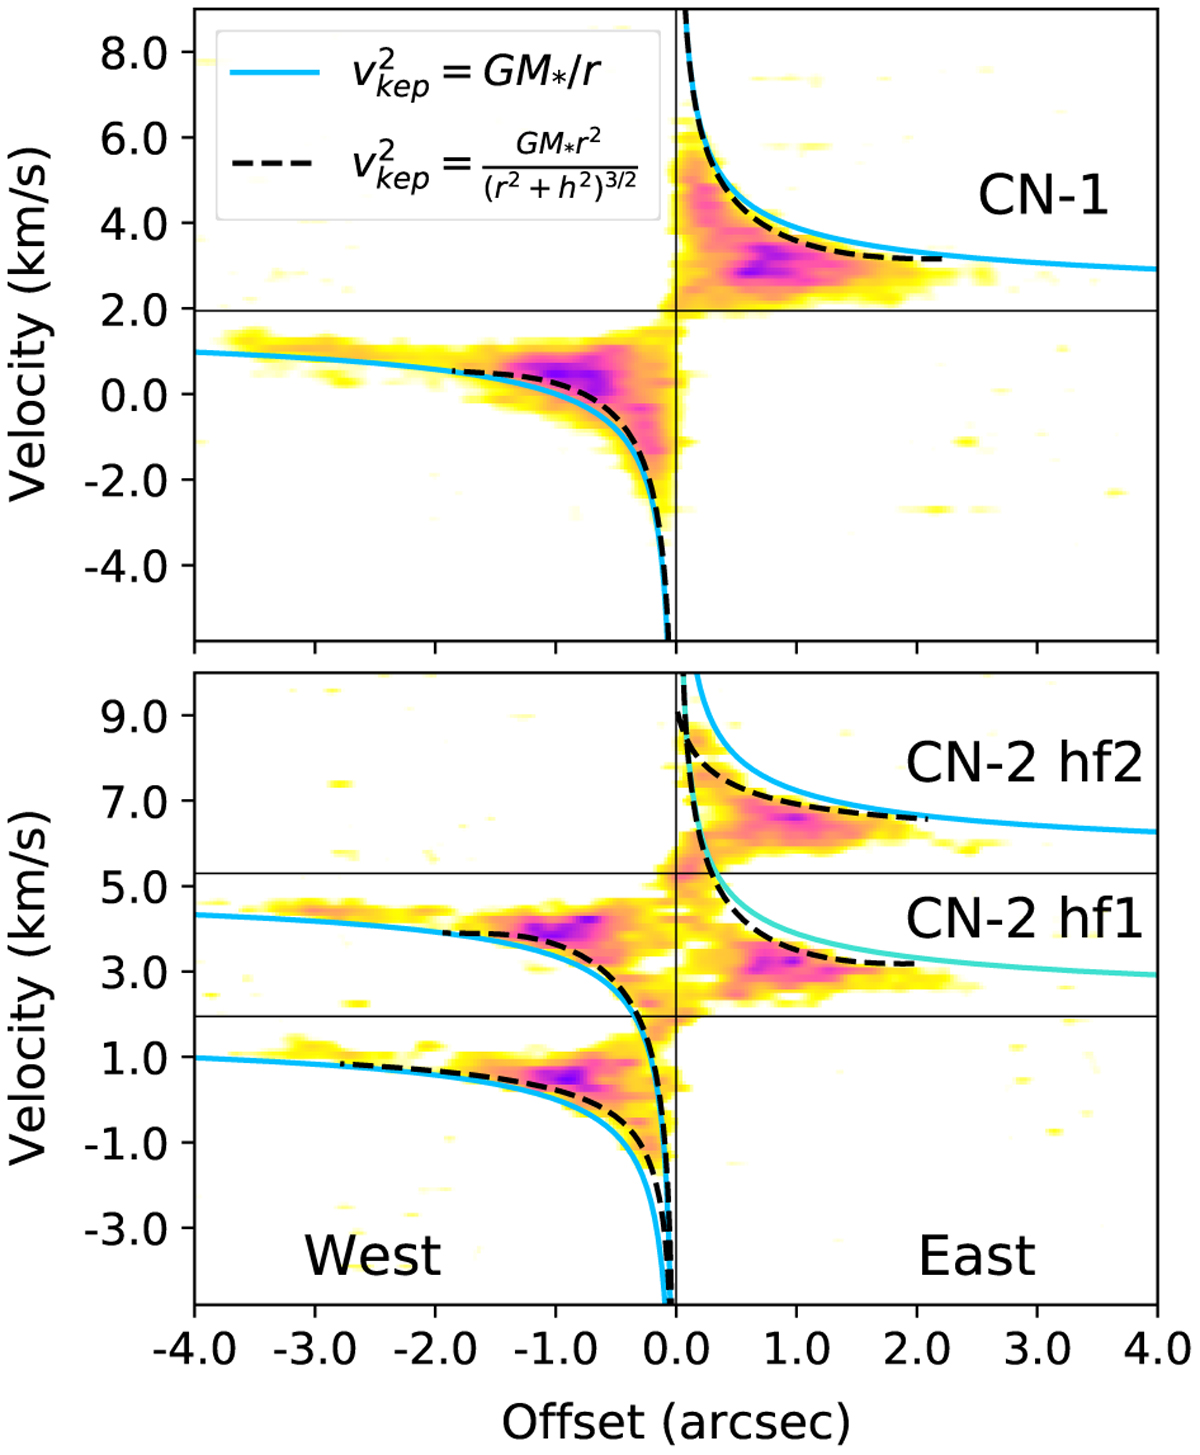
Position-velocity diagrams along the semi-major axis of the disk (PA = 118.8°) for CN-1 (top) and CN-2 (bottom, with two hyperfine group transitions). The offset is positive toward the east side of the disk and negative toward the west. The horizontal lines give the systemic velocity (~1.95 km s−1), shifted for CN-2 hf2 emission to ~5.3 km s−1. The blue curve shows the expected Keplerian velocity curve assuming a flat disk geometry. The dashed black line is the expected Keplerian velocity considering the derived best-fit model for the vertical profile of each tracer. Both models consider a stellar mass of 0.46 M⊙, as derived in Veronesi et al. (2021). The east and west sides of the disk are indicated in the bottom panel for reference.
Current usage metrics show cumulative count of Article Views (full-text article views including HTML views, PDF and ePub downloads, according to the available data) and Abstracts Views on Vision4Press platform.
Data correspond to usage on the plateform after 2015. The current usage metrics is available 48-96 hours after online publication and is updated daily on week days.
Initial download of the metrics may take a while.