Fig. 5
Download original image
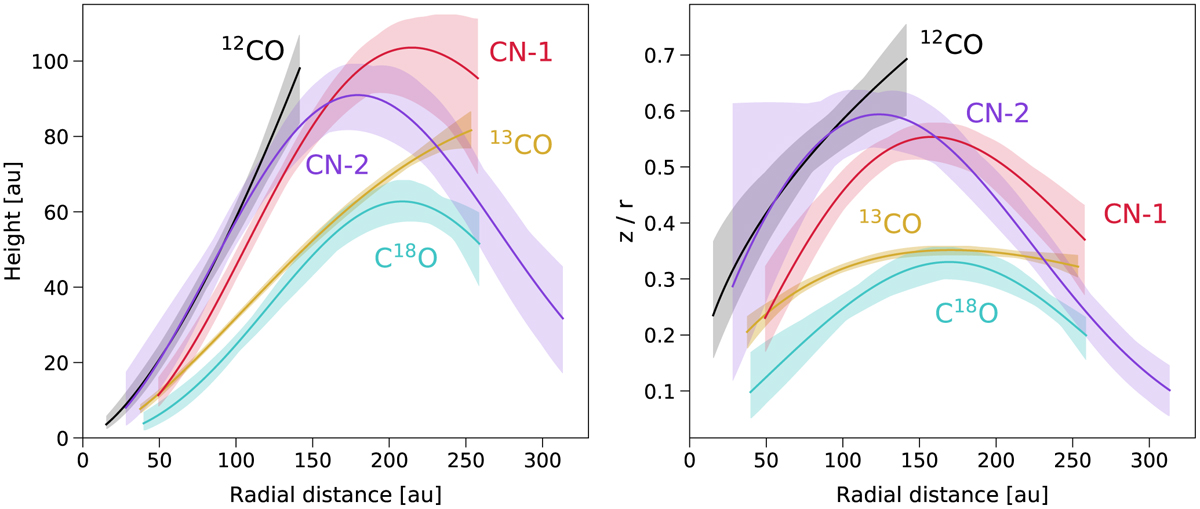
Height (left panel) and z/r (right panel) profiles for the available CO isotopologs and CN transitions in Elias 2-27. The CN emission is separated by a hyperfine group. Solid lines show the best-fit exponentially tapered vertical profile and the shadowed regions show the uncertainty on the best-fit model, derived from the spread of the posteriors in each tracer. Due to the absorption and asymmetries that affect Elias 2-27, the data corresponds to measurements only from the west side of the disk (for all tracers).
Current usage metrics show cumulative count of Article Views (full-text article views including HTML views, PDF and ePub downloads, according to the available data) and Abstracts Views on Vision4Press platform.
Data correspond to usage on the plateform after 2015. The current usage metrics is available 48-96 hours after online publication and is updated daily on week days.
Initial download of the metrics may take a while.