Fig. 4
Download original image
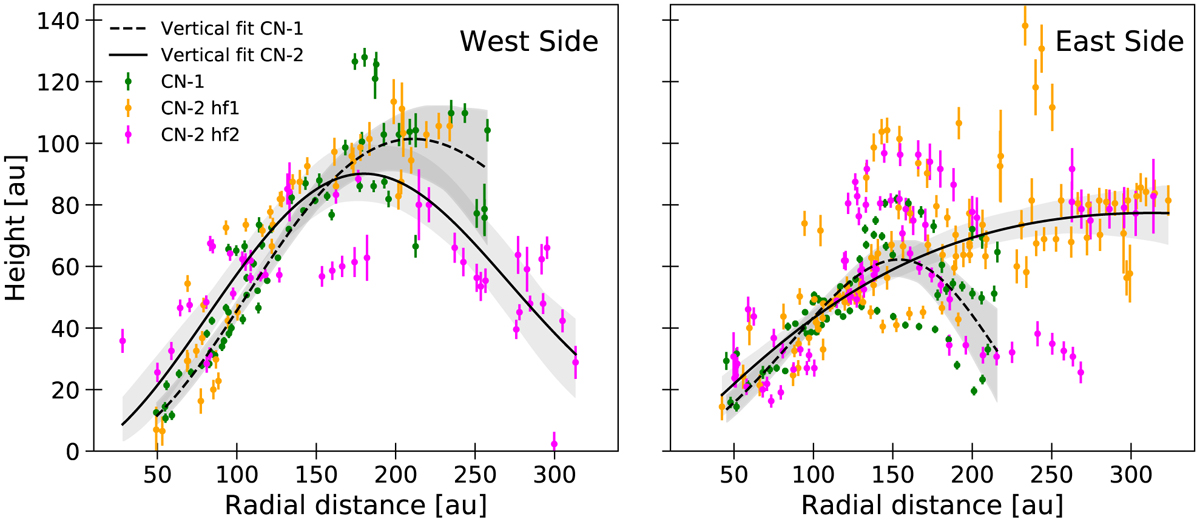
Same data as shown in Fig. 3, but the panels are separated by the west and east sides of the disk. The colored data show the identified CN hyperfine transitions. The solid and dashed black curves show the best-fit vertical models for CN-1 and CN-2, respectively. The light gray region identifies the uncertainties in the best-fit vertical profile, obtained from the spread of the posterior values of the MCMC model.
Current usage metrics show cumulative count of Article Views (full-text article views including HTML views, PDF and ePub downloads, according to the available data) and Abstracts Views on Vision4Press platform.
Data correspond to usage on the plateform after 2015. The current usage metrics is available 48-96 hours after online publication and is updated daily on week days.
Initial download of the metrics may take a while.