Fig. 3
Download original image
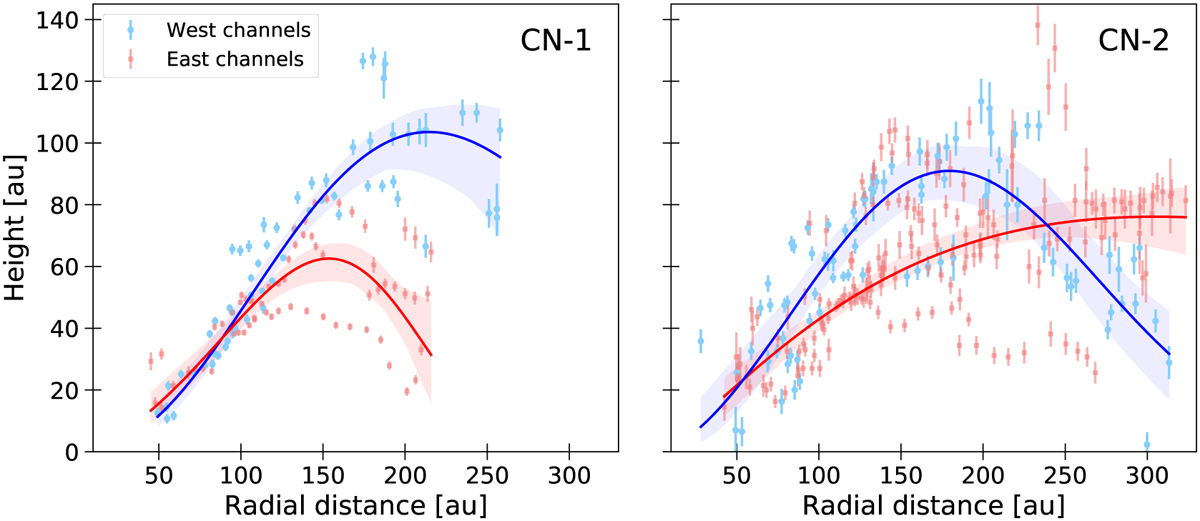
Vertical location of emission from CN-1 (left) and CN-2 (right) transitions, using data obtained from the channel map analysis of the emission. The dataset is separated between the east (red dots) and west (blue dots) sides of the disk, as defined by the semi-minor axis. The solid blue and red curves trace the best-fit exponentially tapered model of each side. The colored regions show the uncertainty of the model, obtained from the spread of the posterior values from our MCMC analysis.
Current usage metrics show cumulative count of Article Views (full-text article views including HTML views, PDF and ePub downloads, according to the available data) and Abstracts Views on Vision4Press platform.
Data correspond to usage on the plateform after 2015. The current usage metrics is available 48-96 hours after online publication and is updated daily on week days.
Initial download of the metrics may take a while.