Fig. B.1
Download original image
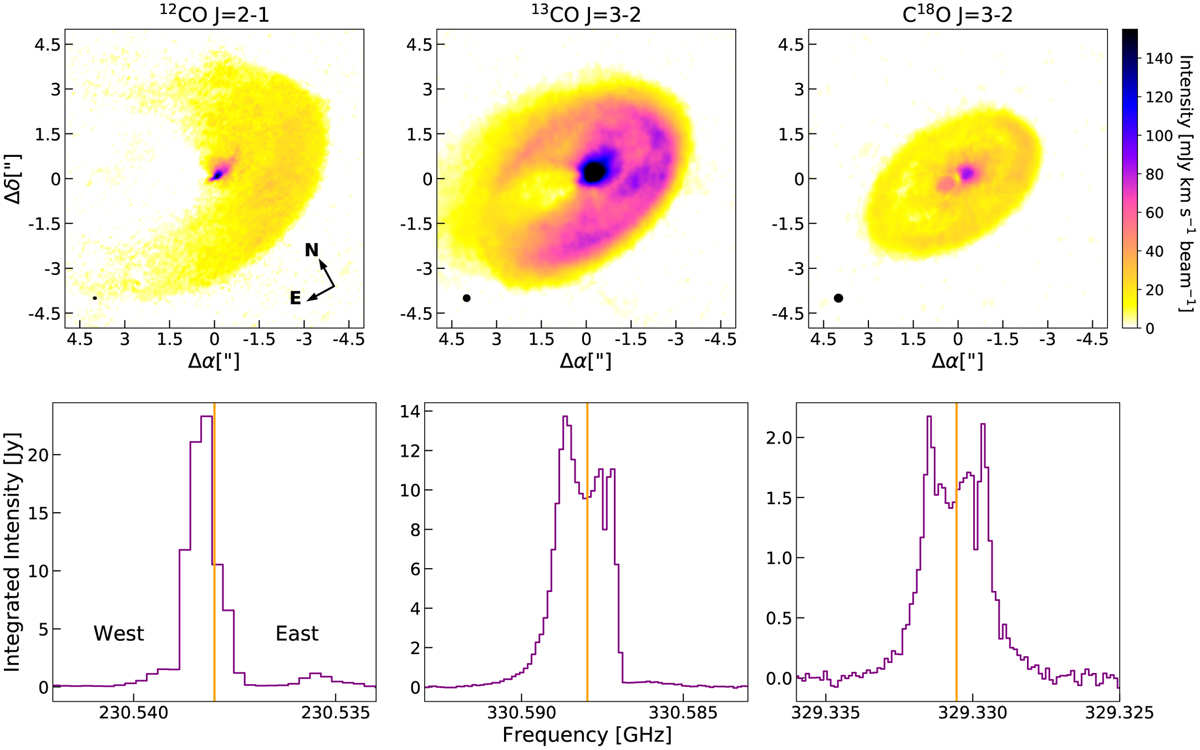
CO isotopolog emission data used in this study. The top row shows the zeroth moment maps for each CO isotopolog. The beam size is shown in the bottom left corner of each panel. The bottom row displays the spectrum of each tracer. 12CO has a resolution of 0.35 km s−1, while 13CO and C18O have a resolution of 0.111 km s−1. The orange vertical line gives the rest frequency in each case.
Current usage metrics show cumulative count of Article Views (full-text article views including HTML views, PDF and ePub downloads, according to the available data) and Abstracts Views on Vision4Press platform.
Data correspond to usage on the plateform after 2015. The current usage metrics is available 48-96 hours after online publication and is updated daily on week days.
Initial download of the metrics may take a while.