Fig. 1
Download original image
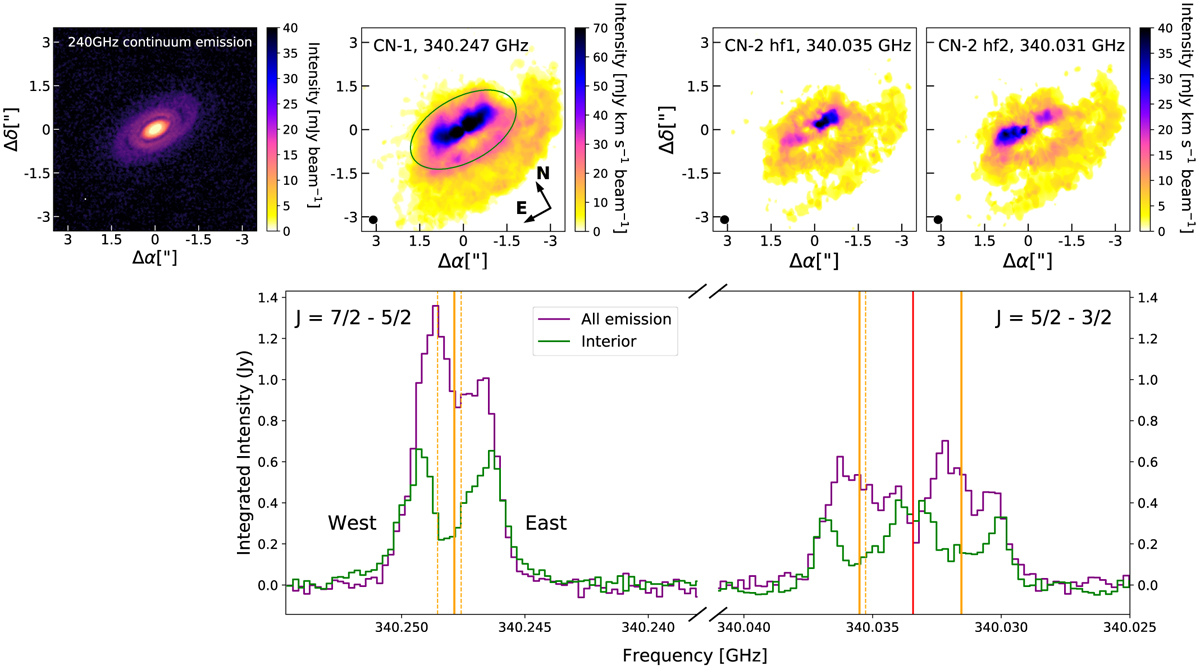
Continuum and CN datasets for Elias 2-27. Top row: high-resolution 240 GHz dust continuum emission (left). The subsequent panels (from left to right) show the integrated intensity (zeroth moment) for CN J = 7/2–5/2 (CN-1), and the CN J = 5/2–3/2 hyperfine group transitions at ~340.035 GHz (CN-2 hf1) and ~340.031 GHz (CN-2 hf2). The frequency of each group is shown at the top of each panel and the ellipses in the bottom left corners show the beam size. In the left panel the green ellipse indicates the region within 230 au from the center (interior region), assuming a flat geometry. Bottom row: Disk integrated spectrum for the whole emitting region (in purple) and for only the interior region (in green). The orange vertical lines indicate the hyperfine transition frequencies that are blended in each peak. When there are multiple transitions, the solid vertical line indicates the one with the higher relative intensity (values in Table 1). The red vertical line is the separation between the CN-2 hyperfine groups.
Current usage metrics show cumulative count of Article Views (full-text article views including HTML views, PDF and ePub downloads, according to the available data) and Abstracts Views on Vision4Press platform.
Data correspond to usage on the plateform after 2015. The current usage metrics is available 48-96 hours after online publication and is updated daily on week days.
Initial download of the metrics may take a while.