Open Access
Fig. 8.
Download original image
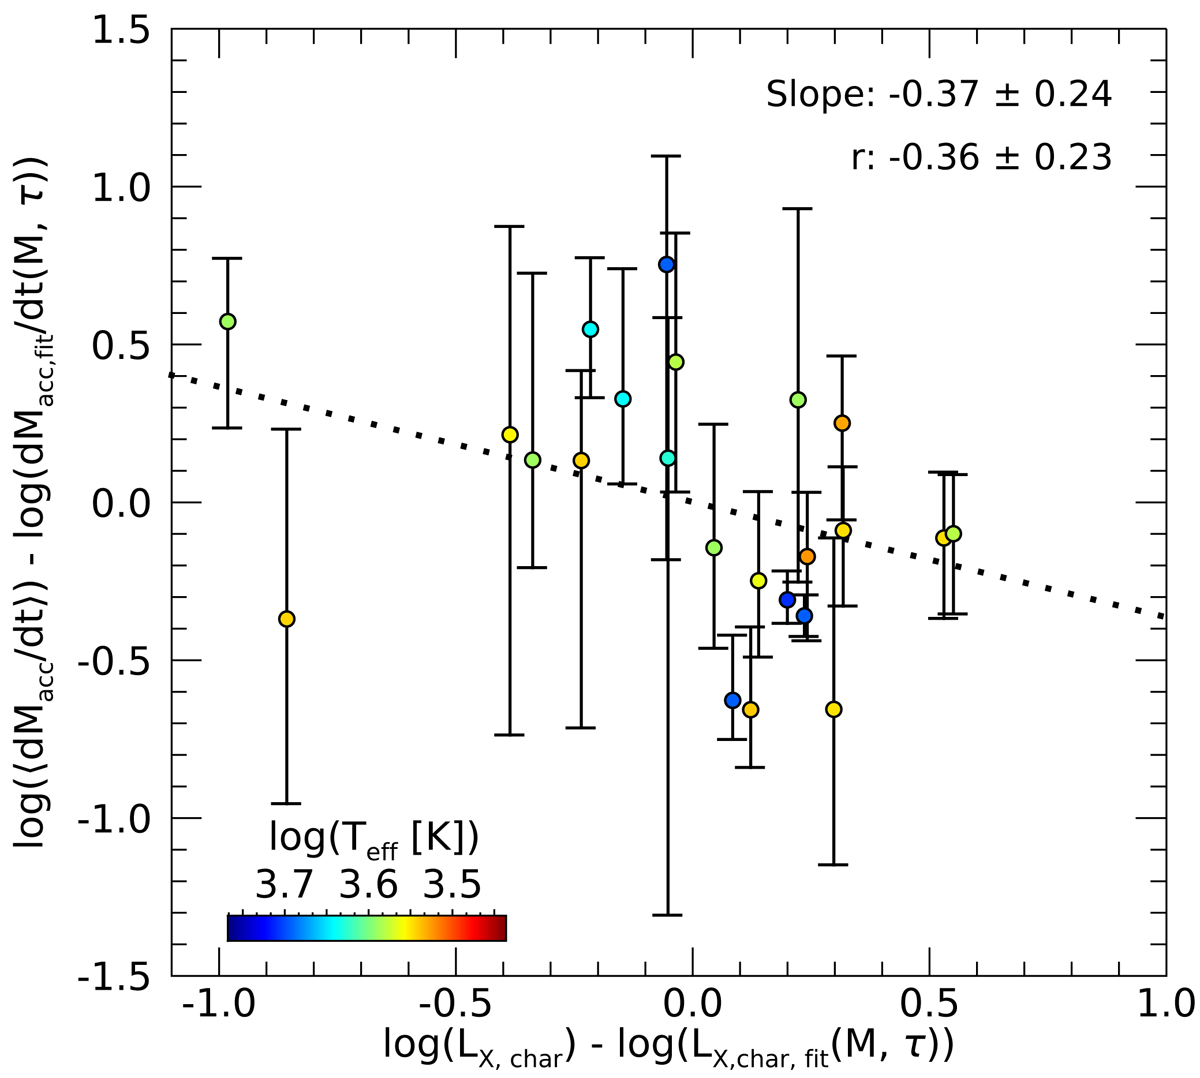
Residual accretion rates vs. residual X-ray luminosities for the ONC taking both the mean mass and the mean isochronal age dependence into account. The dotted line shows the best fit obtained with LINMIX_ERR. The solid bars indicate the maximum and the minimum residual accretion rates for each source.
Current usage metrics show cumulative count of Article Views (full-text article views including HTML views, PDF and ePub downloads, according to the available data) and Abstracts Views on Vision4Press platform.
Data correspond to usage on the plateform after 2015. The current usage metrics is available 48-96 hours after online publication and is updated daily on week days.
Initial download of the metrics may take a while.