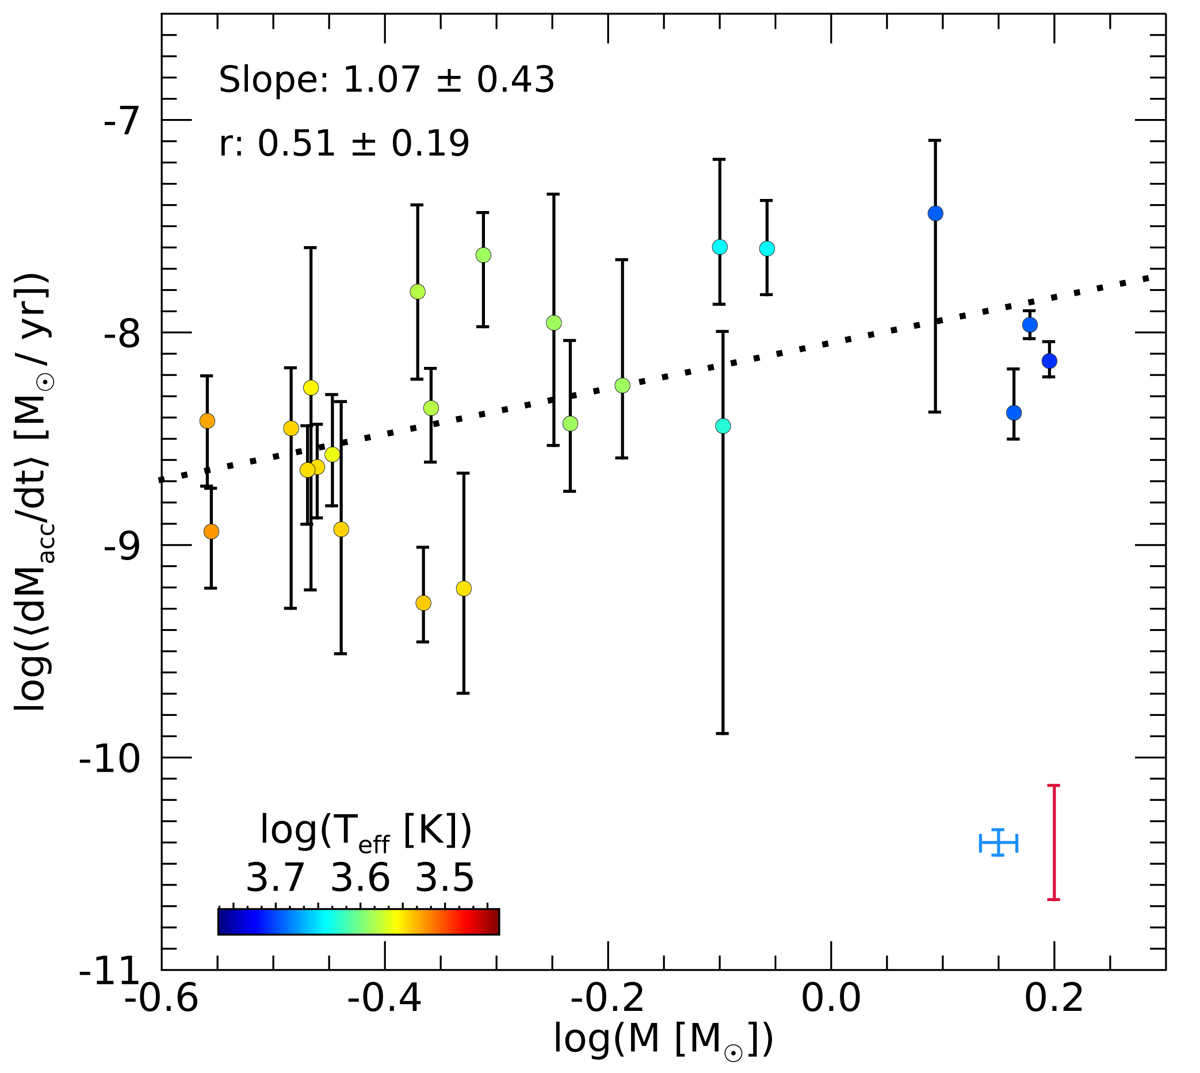
Fig. 7.
Download original image
Logarithmic mean mass accretion rates vs. logarithm of the masses shown as solid dots. The solid bars indicate the maximum and the minimum accretion rates for each source. The dotted line shows the result of the regression obtained with the Bayesian LINMIX_ERR method. The blue cross shows the typical uncertainty of the values, the red bar the typical variability range.
Current usage metrics show cumulative count of Article Views (full-text article views including HTML views, PDF and ePub downloads, according to the available data) and Abstracts Views on Vision4Press platform.
Data correspond to usage on the plateform after 2015. The current usage metrics is available 48-96 hours after online publication and is updated daily on week days.
Initial download of the metrics may take a while.