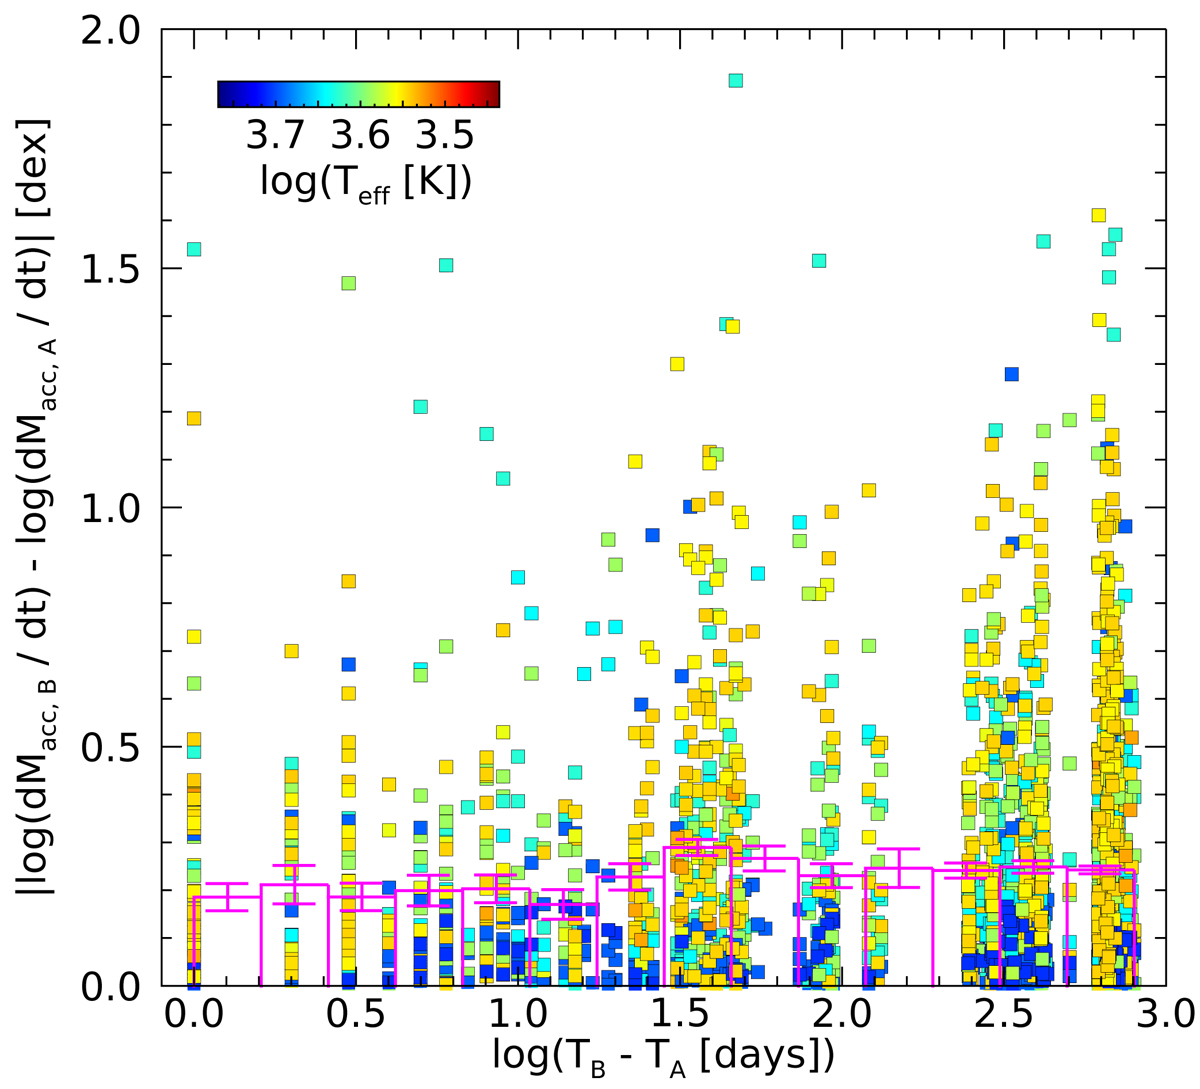
Fig. 6.
Download original image
Differences of the logarithmic mass accretion rates for two epochs TA and TB as a function of the logarithmic time differences TB − TA for each measurement. The values are plotted as squares, where for each distinct object a different color was chosen according to its effective temperature. Overlaid are the mean values of the logarithmic mass accretion rate differences for different time bins as magenta columns, together with their estimated 1σ uncertainties.
Current usage metrics show cumulative count of Article Views (full-text article views including HTML views, PDF and ePub downloads, according to the available data) and Abstracts Views on Vision4Press platform.
Data correspond to usage on the plateform after 2015. The current usage metrics is available 48-96 hours after online publication and is updated daily on week days.
Initial download of the metrics may take a while.