Fig. 5.
Download original image
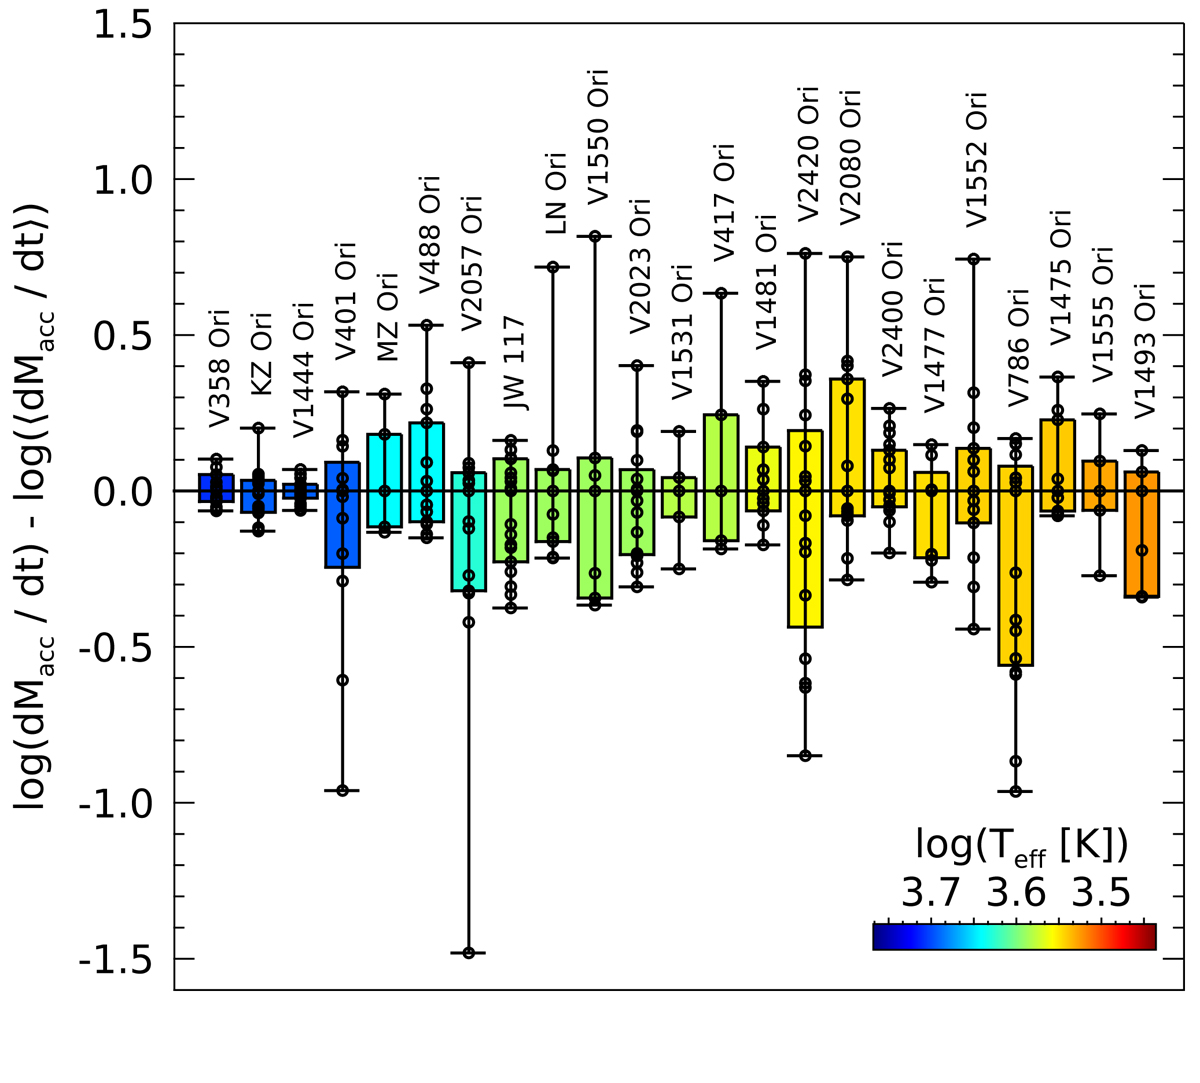
Boxplot showing the accretion rate variability of the targets. The vertical solid lines indicate the range of the accretion rates and the height of the boxes the interquartile range. The circles show the accretion rates for each target and epoch. The values are normalized to the median values and color-coded according to their effective temperature.
Current usage metrics show cumulative count of Article Views (full-text article views including HTML views, PDF and ePub downloads, according to the available data) and Abstracts Views on Vision4Press platform.
Data correspond to usage on the plateform after 2015. The current usage metrics is available 48-96 hours after online publication and is updated daily on week days.
Initial download of the metrics may take a while.