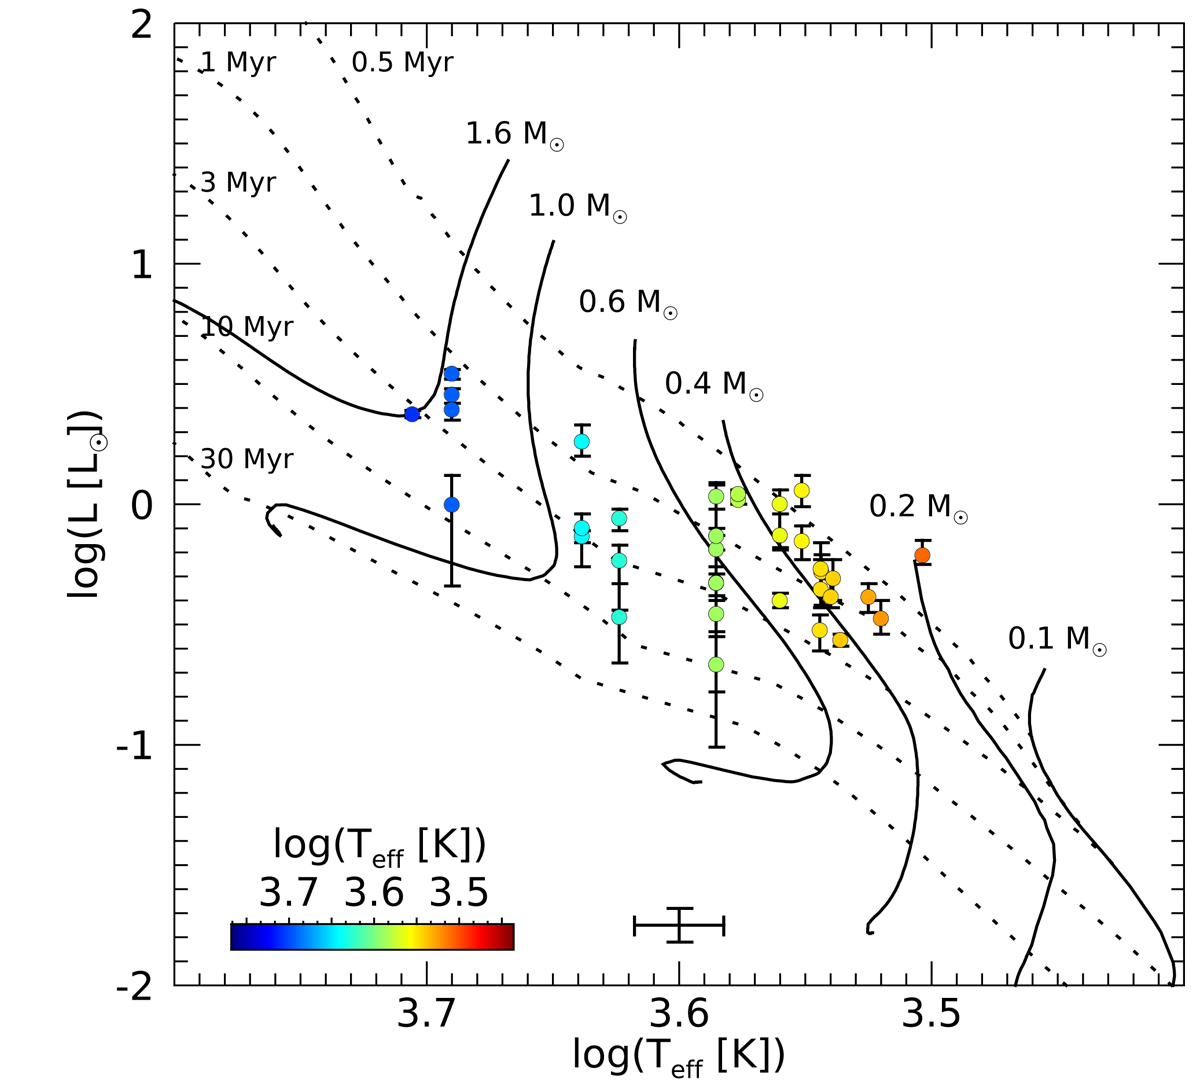
Fig. 4.
Download original image
Hertzsprung-Russel diagram of the observed sources. Overlaid are the PARSEC 1.2S isochrones and mass tracks from Bressan et al. (2012). The dots represent the mean bolometric luminosity for each star as a function of Teff. The vertical bars indicate the minimum and maximum range of L* for each star. The cross at the bottom shows the typical uncertainty. In our analysis, we only regarded sources with 0.2 M⊙ ≤ M ≤ 2.0 M⊙ and 5.5 ≤ log(τ[yr]) ≤ 7.3 in order to exclude outliers in the Hertzsprung-Russel diagram.
Current usage metrics show cumulative count of Article Views (full-text article views including HTML views, PDF and ePub downloads, according to the available data) and Abstracts Views on Vision4Press platform.
Data correspond to usage on the plateform after 2015. The current usage metrics is available 48-96 hours after online publication and is updated daily on week days.
Initial download of the metrics may take a while.