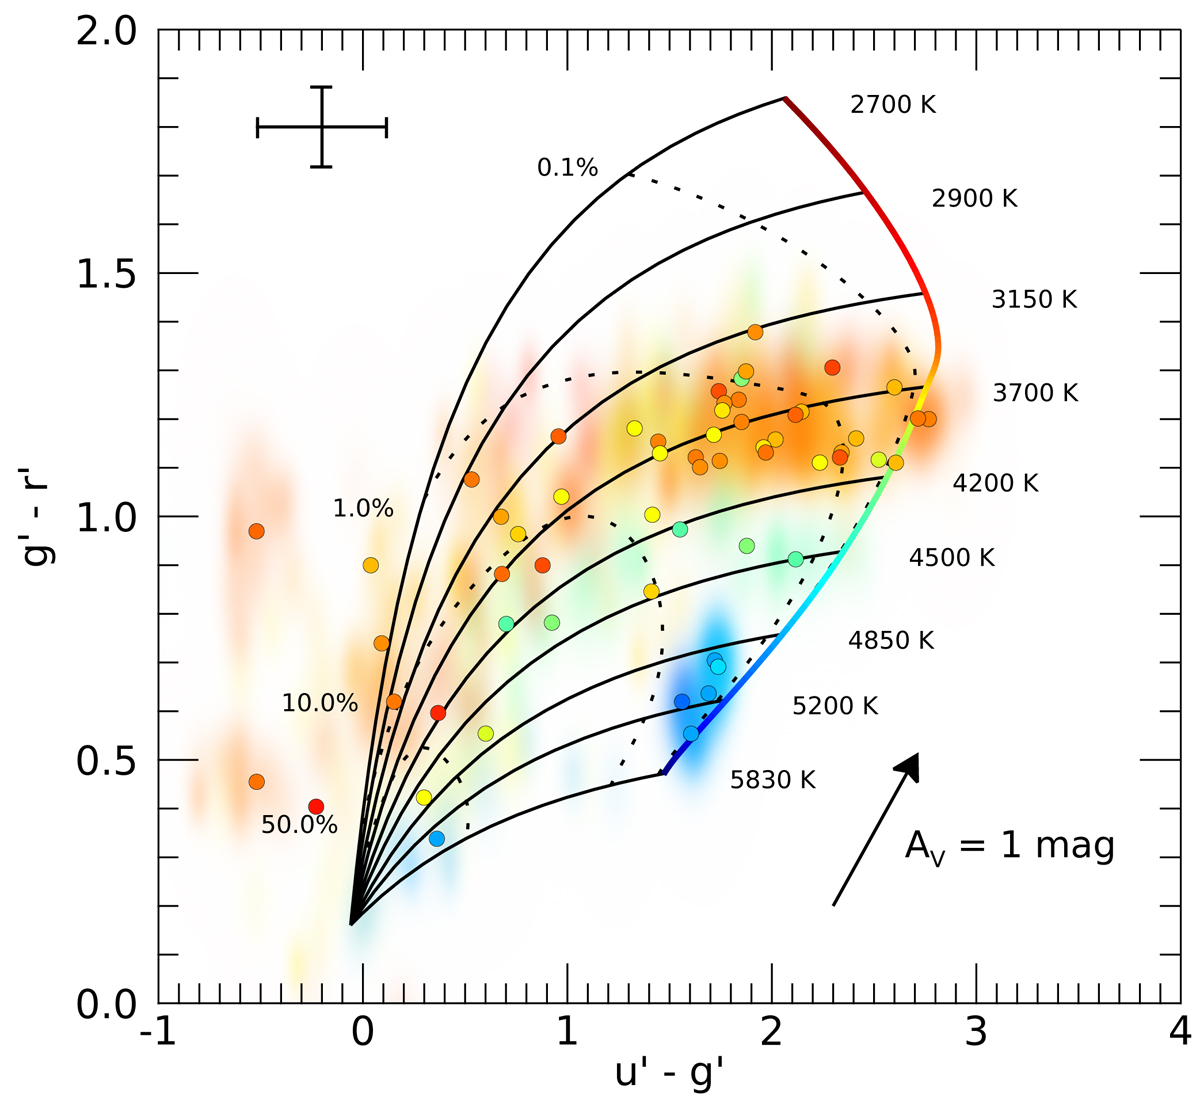
Fig. 3.

Download original image
Color-color diagram of the WWFI sample, dereddened with the extinction values determined by Manara et al. (2012) and plotted as 2D Gaussians according to their photometric uncertainties. The values are colored according to their Teff value. Overlaid are the mean colors for each star as solid dots. The cross in the upper left corner indicates their typical range of variability. The thick line shows the photospheric colors for non-accreting stars. The thin lines represent tracks along which the sources are displaced from the photospheric track for increasing accretion. They converge in a point representing the pure accretion spectrum, described by a hydrogen slab model. The dotted lines indicate constant accretion to total luminosities ratios, Lacc/Ltot.
Current usage metrics show cumulative count of Article Views (full-text article views including HTML views, PDF and ePub downloads, according to the available data) and Abstracts Views on Vision4Press platform.
Data correspond to usage on the plateform after 2015. The current usage metrics is available 48-96 hours after online publication and is updated daily on week days.
Initial download of the metrics may take a while.


