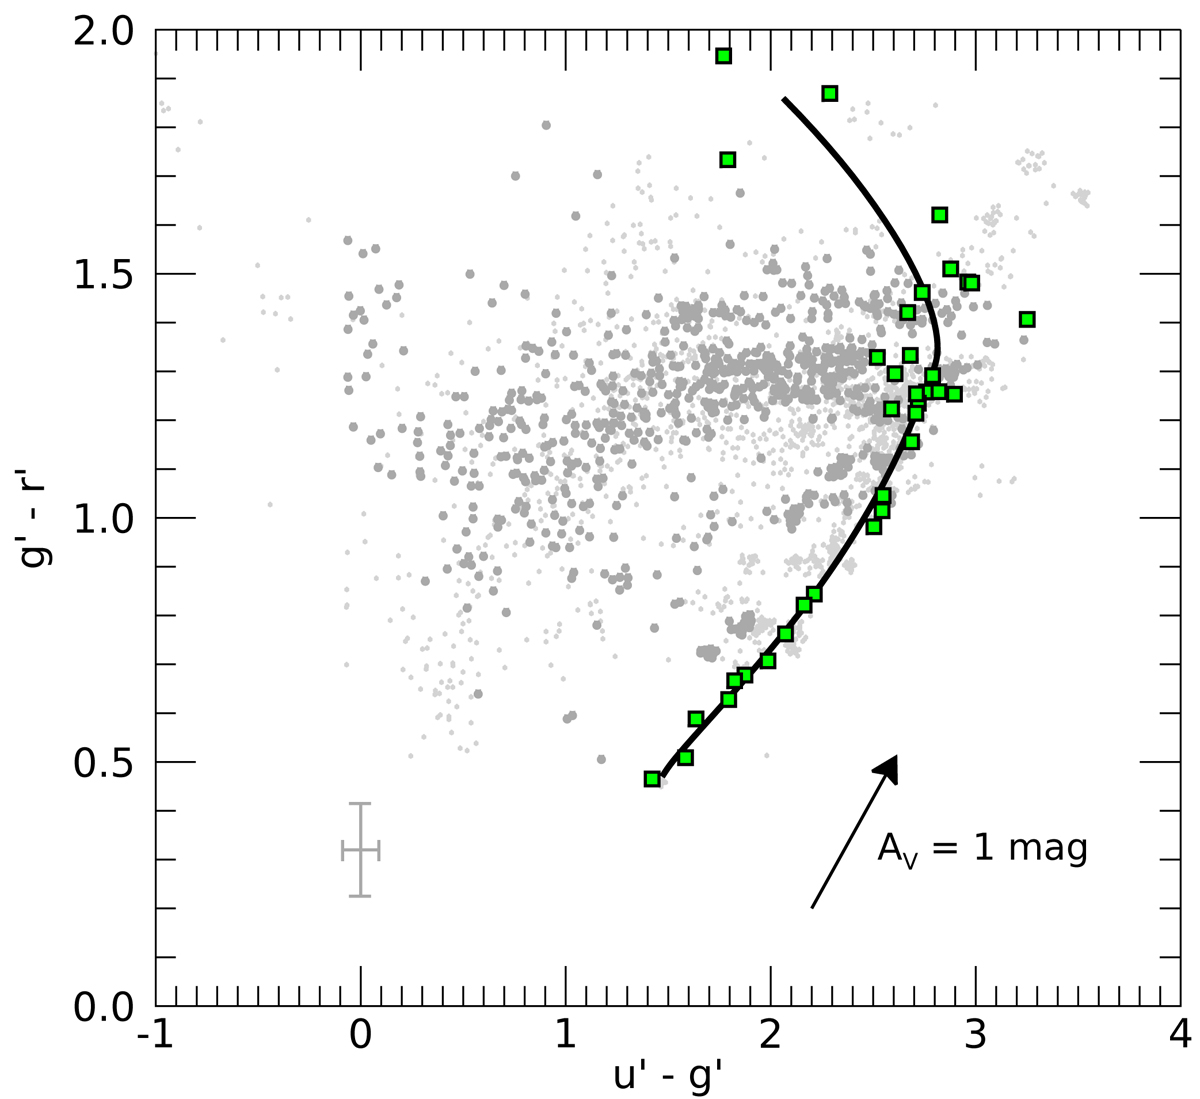
Fig. 2.
Download original image
g′−r′ vs. u′−g′ color-color diagram of YSOs monitored with WWFI as gray dots. The bigger dots indicate the objects displaying accretion according to Manara et al. (2012). The gray cross shows the typical uncertainty of the photometry. The thick line is the sequence tracing the colors of the photosphere, obtained by synthetic photometry on spectra of diskless class III objects observed with X-shooter (Manara et al. 2013, 2017b). The colors of these template spectra are shown as green squares. The arrow traces the reddening vector for AV = 1 mag, assuming the reddening law of Cardelli et al. (1989) and a galactic reddening parameter of RV = 3.1.
Current usage metrics show cumulative count of Article Views (full-text article views including HTML views, PDF and ePub downloads, according to the available data) and Abstracts Views on Vision4Press platform.
Data correspond to usage on the plateform after 2015. The current usage metrics is available 48-96 hours after online publication and is updated daily on week days.
Initial download of the metrics may take a while.