Fig. 7
Download original image
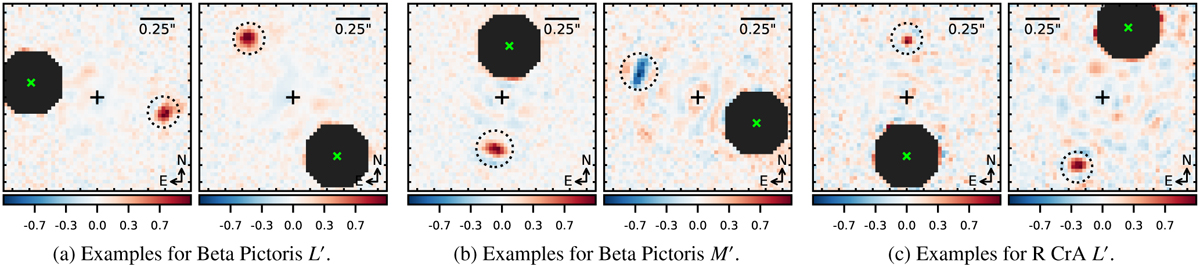
Example results of experiment in Sect. 5.2. Each figure shows a map of the coefficients that constitute the (linear) noise model for the target pixel (green cross). The coefficients have been normalized such that the largest absolute value in each frame is 1. The dark areas are the respective exclusion regions. We notice a familiar pattern: the pixels with the highest (absolute) value – that is, the pixels that contribute most to the prediction of the model – are found in a region that is symmetric across the origin from the target pixel of the model. We indicate this region by a dotted circle with a radius equal to 1 FWHM of the respective PSF template. □
Current usage metrics show cumulative count of Article Views (full-text article views including HTML views, PDF and ePub downloads, according to the available data) and Abstracts Views on Vision4Press platform.
Data correspond to usage on the plateform after 2015. The current usage metrics is available 48-96 hours after online publication and is updated daily on week days.
Initial download of the metrics may take a while.