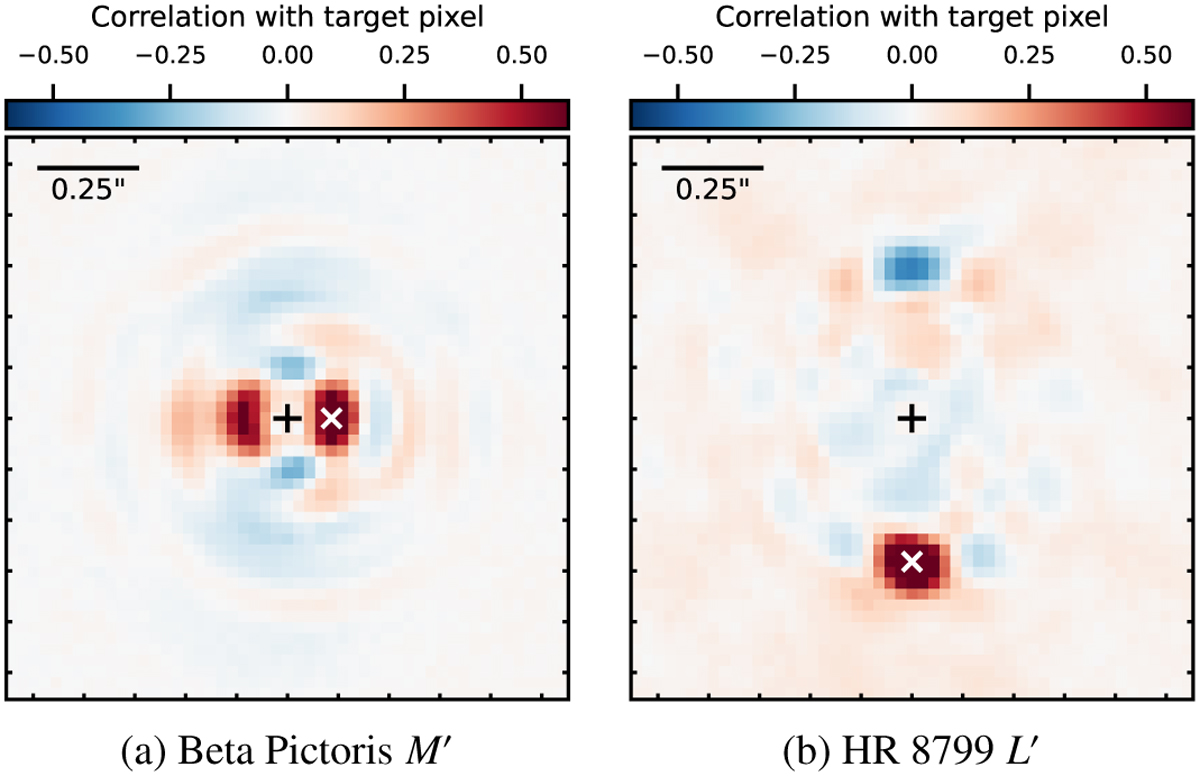
Fig. A.2
Download original image
Example results for mini-experiment 2 (correlation coefficients). We color-code the correlation coefficient of every pixel with a given target pixel (marked by a white cross). We see that the target pixels are strongly (anti)correlated with their immediate neighborhood, but also with a similarly sized region symmetrically across the center. □
Current usage metrics show cumulative count of Article Views (full-text article views including HTML views, PDF and ePub downloads, according to the available data) and Abstracts Views on Vision4Press platform.
Data correspond to usage on the plateform after 2015. The current usage metrics is available 48-96 hours after online publication and is updated daily on week days.
Initial download of the metrics may take a while.