Fig. 13
Download original image
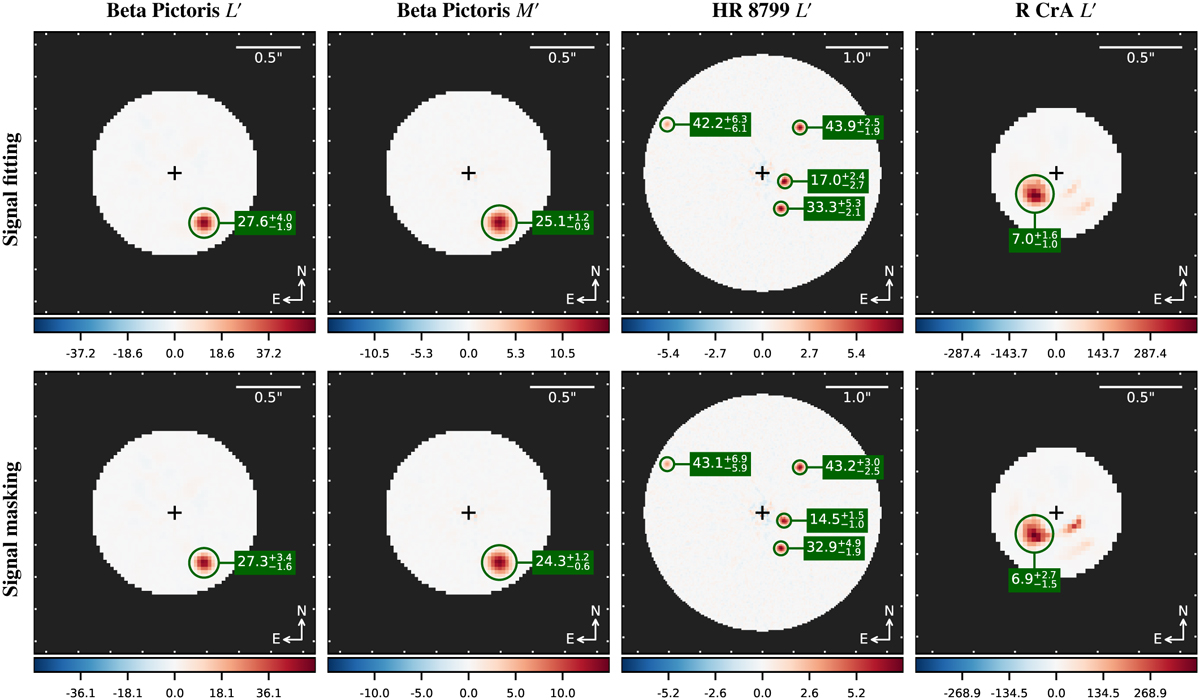
Results of experiment in Sect. 6.4. The setup is equivalent to experiment in Sect. 5.1, except that we add the observing conditions as additional predictors (see Fig. 6, or Table 3, for comparison). Again, the images show the signal estimates in units of flux (i.e., in the same units as the input data) and the numbers that label the planets are the respective −log10(FPF) scores. □
Current usage metrics show cumulative count of Article Views (full-text article views including HTML views, PDF and ePub downloads, according to the available data) and Abstracts Views on Vision4Press platform.
Data correspond to usage on the plateform after 2015. The current usage metrics is available 48-96 hours after online publication and is updated daily on week days.
Initial download of the metrics may take a while.