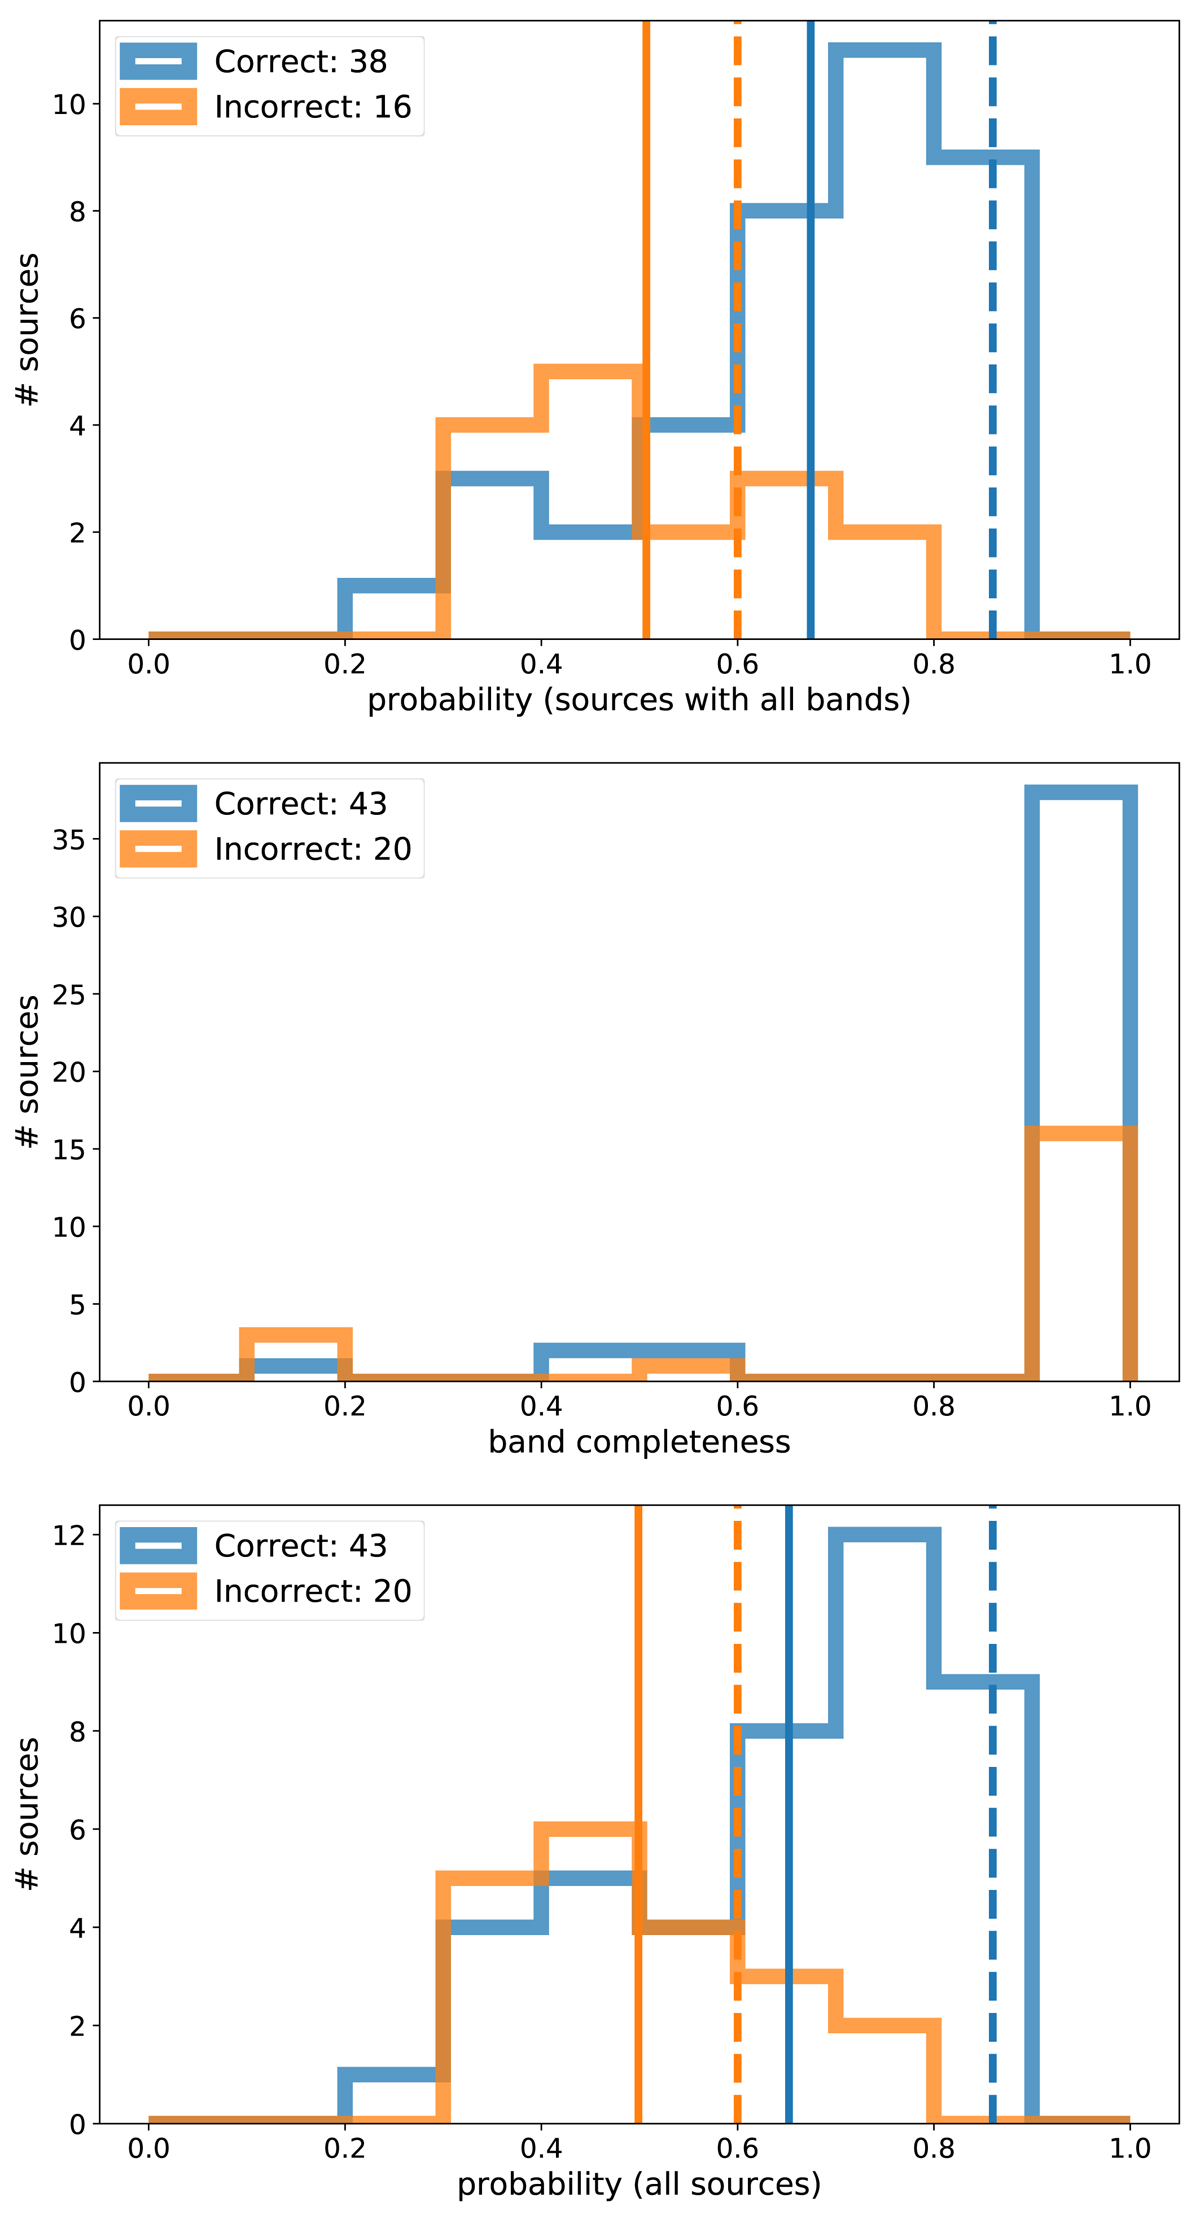
Fig. 8.
Download original image
Probability and band completeness distributions for the sources of the three galaxies (IC 1613, WLM, and Sextans A) with and without missing data. Top: probability distributions of the correct (blue) and incorrect (orange) final classifications for the total sample of stars with known spectral types and with measurements in all bands. We achieved a recovery rate of ∼70%. The vertical dashed lines are the same as those in Fig. 6; the solid lines correspond to the peak of the probability distributions for the current sample. Middle: Distribution of the band completeness, i.e., the fraction of features without missing values. Bottom: probability distributions for all sources, including those without measurements in multiple bands (vertical lines have the same meaning as in the top panel). The success rate of ∼68% is the same as in the top panel, indicating the effectiveness of the iterative imputer for missing data imputation.
Current usage metrics show cumulative count of Article Views (full-text article views including HTML views, PDF and ePub downloads, according to the available data) and Abstracts Views on Vision4Press platform.
Data correspond to usage on the plateform after 2015. The current usage metrics is available 48-96 hours after online publication and is updated daily on week days.
Initial download of the metrics may take a while.