Fig. 3.
Download original image
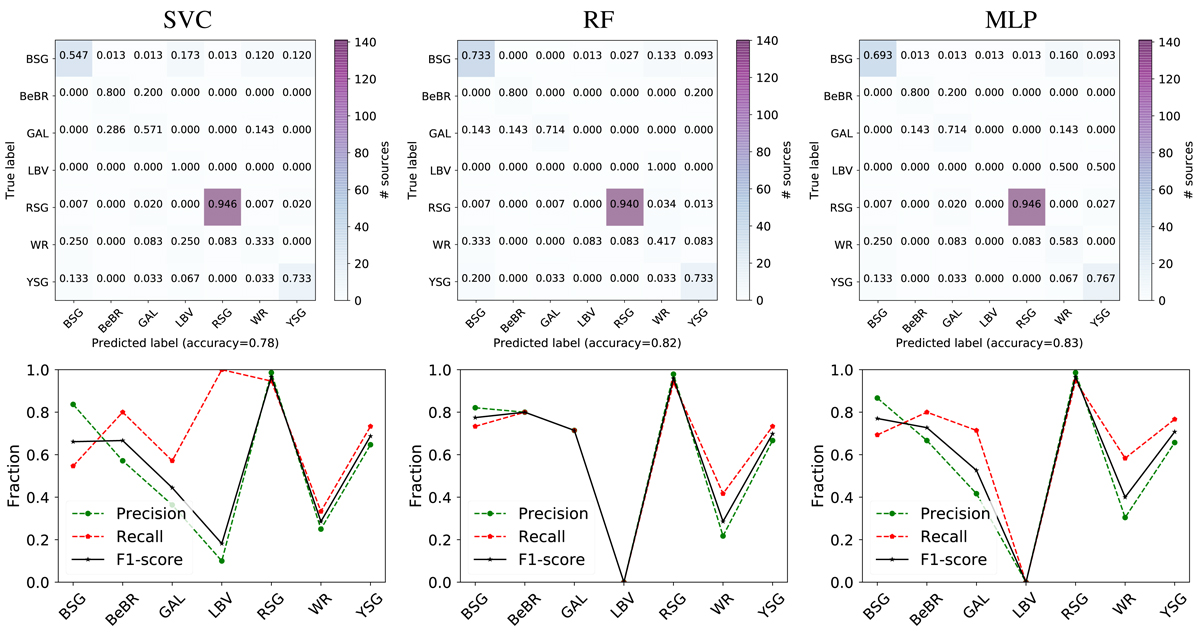
Confusion matrices (upper panels) for the SVC, RF, and MLP methods, respectively, along with the characteristic metrics (precision, recall, and F1 score; lower panels). These results originate from single runs, i.e., by using 70% of the initial sample for the training sample, which is then resampled to produce a balanced sample before training each model and applying the model to the remaining 30% of the sample (the validation). In general, the algorithms perform well except for the cases of LBVs and WRs (see Sect. 4.1 for more details).
Current usage metrics show cumulative count of Article Views (full-text article views including HTML views, PDF and ePub downloads, according to the available data) and Abstracts Views on Vision4Press platform.
Data correspond to usage on the plateform after 2015. The current usage metrics is available 48-96 hours after online publication and is updated daily on week days.
Initial download of the metrics may take a while.