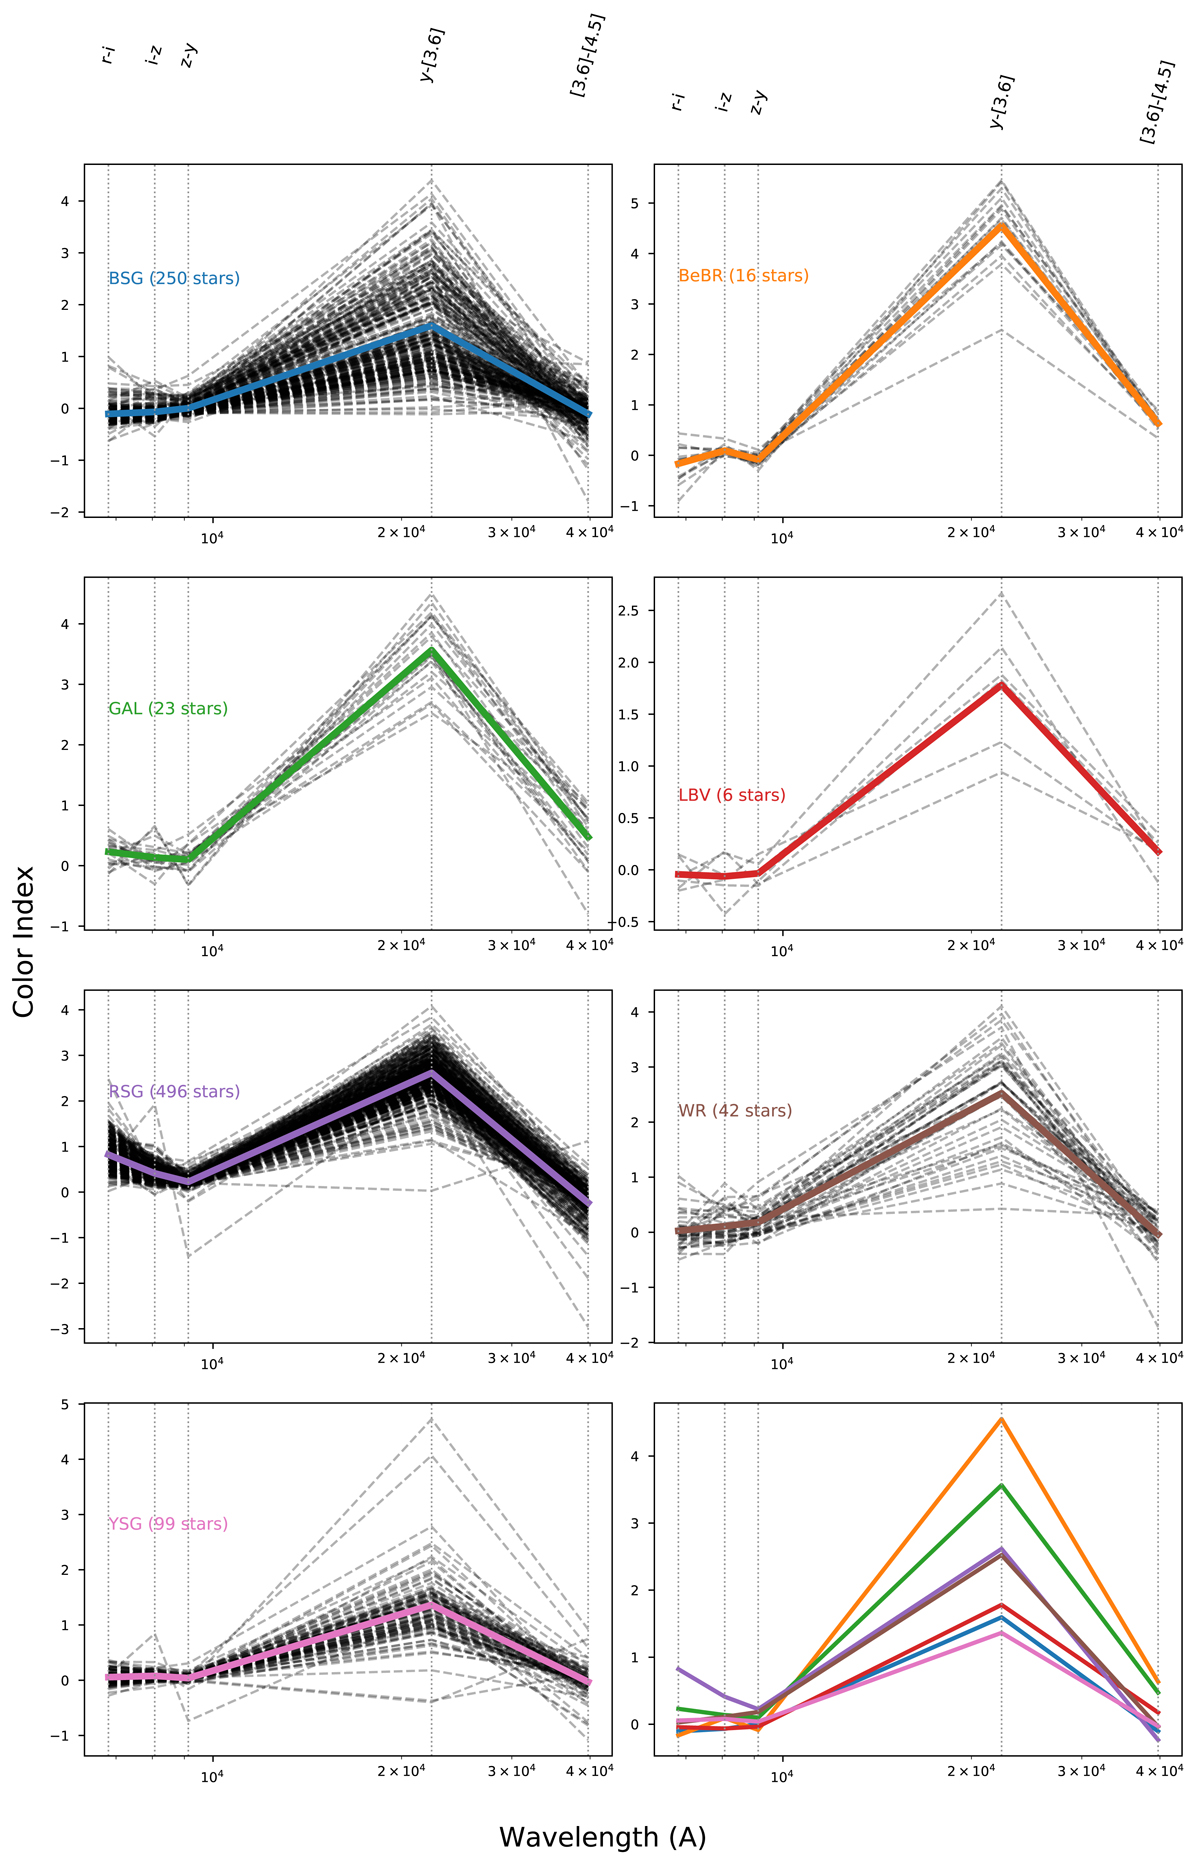
Fig. 2.
Download original image
Color indices (features) vs. wavelength per class. The dashed black lines correspond to the individual sources, and the solid colored lines corresponds to their average. The last panel contains only the averaged lines to highlight the differences between the classes, with the most pronounced differences in the y − [3.6] index (as BeBRs are the brightest IR sources, on average, followed by the GAL, RSG, and WR classes; see text for more). The number of sources in each panel corresponds to the total number of selected sources (see Table 2, Col. 5). The vertical dashed lines correspond to the average wavelength per color index, as shown at the top of the figure.
Current usage metrics show cumulative count of Article Views (full-text article views including HTML views, PDF and ePub downloads, according to the available data) and Abstracts Views on Vision4Press platform.
Data correspond to usage on the plateform after 2015. The current usage metrics is available 48-96 hours after online publication and is updated daily on week days.
Initial download of the metrics may take a while.