Fig. 1.
Download original image
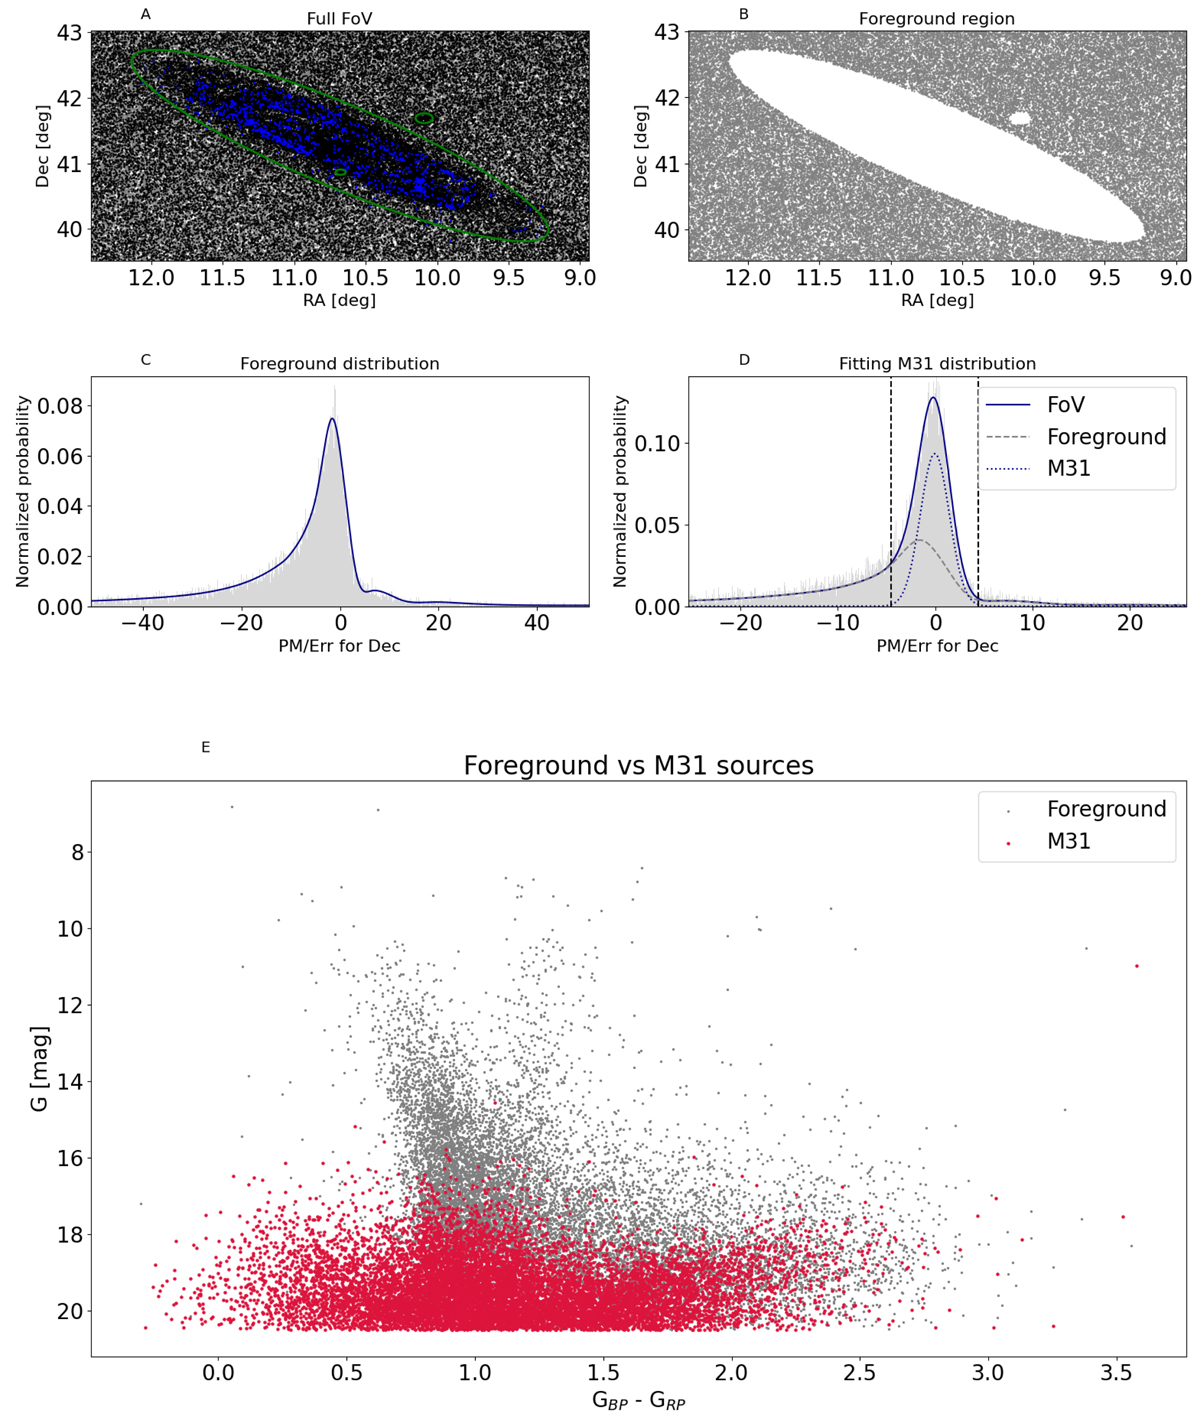
Using Gaia to identify and remove foreground sources. (A) Field-of-view of Gaia sources (black dots) for M 31. The big green ellipse marks the boundary we defined for the M 31 galaxy, and the smaller green ellipses define M 110 and M 32 (inside the M 31 ellipse) and are excluded. The blue dots highlight the sources in M 31 with known spectral classification. (B) Foreground region, excluding the sources inside M 110. (C) Distribution of the proper motion over its error for Dec, for all Gaia sources in the foreground region, fitted with a spline function. (D) Distribution of the proper motion over its error for Dec (solid line), for all sources along the line-of-sight of M 31, which includes both foreground and galactic (M 31) sources. We fitted this with a scaled spline, to account for the number of foreground sources expected inside M 31 (dashed line), and a Gaussian function (dotted line). The vertical dashed lines correspond to the 3σ threshold of the Gaussian. Any source with values outside this region is flagged as a potential foreground source. (E) Gaia CMD of all sources identified as galactic (red points) and foreground (gray). The majority of the foreground sources lie on the yellow branch of the CMD, which is exactly the position at which we expect the largest fraction of the contamination.
Current usage metrics show cumulative count of Article Views (full-text article views including HTML views, PDF and ePub downloads, according to the available data) and Abstracts Views on Vision4Press platform.
Data correspond to usage on the plateform after 2015. The current usage metrics is available 48-96 hours after online publication and is updated daily on week days.
Initial download of the metrics may take a while.