Fig. C.1
Download original image
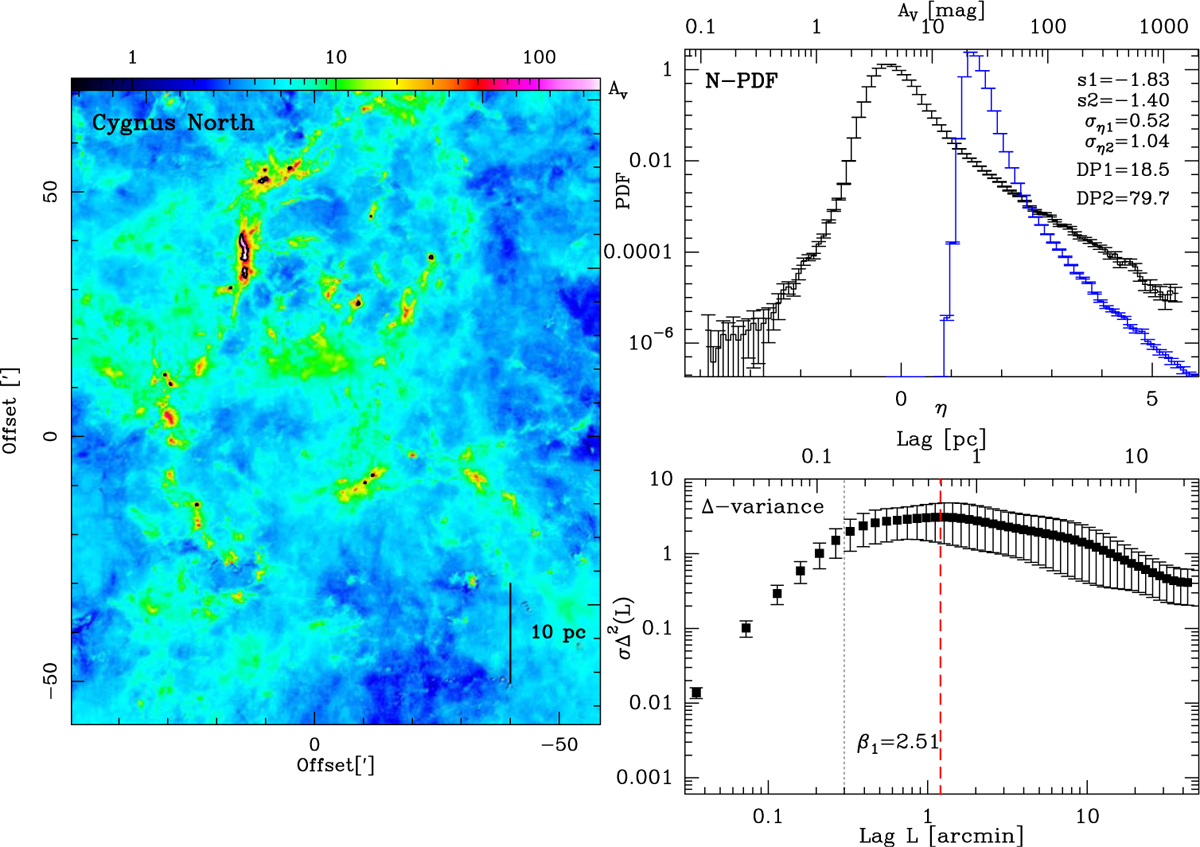
CYGNUS X NORTH (DR21): Left: LOS corrected column density map in visual extinction. The image is rotated and a length scale is given in the panel. For the cloud N-PDFs with two PLTs, the contour of the second DP is plotted in black. Right (lower panel): ∆-variance spectrum. X-axis units are arcmin (bottom) and parsec (top). The black dashed line indicates the angular resolution (18″), the first red dashed line indicates the upper limit for the fit of β1 (the lower limit is the resolution limit) and in case there are two fitting intervalls, two other red dashed lines indicate the fit range for β2. The values of β1 and β2 are given in the panel. The errors are omitted for better visibility, they are always on the order of 0.01 to 0.03. Right (top panel): N-PDF of LOS corrected column density in black, expressed in visual extinction (upper x-axis) and in η (lower x-axis). For comparison, the N-PDF of the uncorrected map is displayed in blue. The slope s of the PLT, the width σ (expressed in η) of the log-normal part of the (corrected) N-PDF, and the deviation point DP (expressed in AV) are given in the panel.
Current usage metrics show cumulative count of Article Views (full-text article views including HTML views, PDF and ePub downloads, according to the available data) and Abstracts Views on Vision4Press platform.
Data correspond to usage on the plateform after 2015. The current usage metrics is available 48-96 hours after online publication and is updated daily on week days.
Initial download of the metrics may take a while.