Open Access
Fig. B.1
Download original image
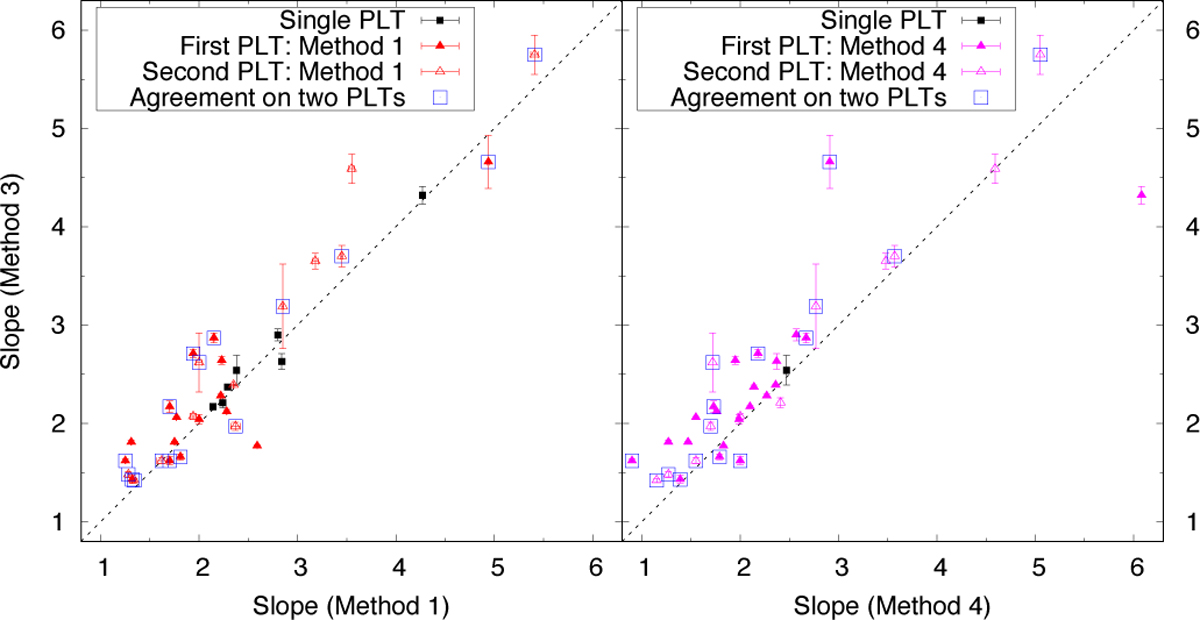
Comparison of slope estimations from the three PLTs fitting methods described in Sec. 2.4.1. Absolute slope values are given and the identity line is plotted as a dashed line. Different symbols are used for one or two PLTs. We note that the methods do not always agree on the number of PLTs.
Current usage metrics show cumulative count of Article Views (full-text article views including HTML views, PDF and ePub downloads, according to the available data) and Abstracts Views on Vision4Press platform.
Data correspond to usage on the plateform after 2015. The current usage metrics is available 48-96 hours after online publication and is updated daily on week days.
Initial download of the metrics may take a while.