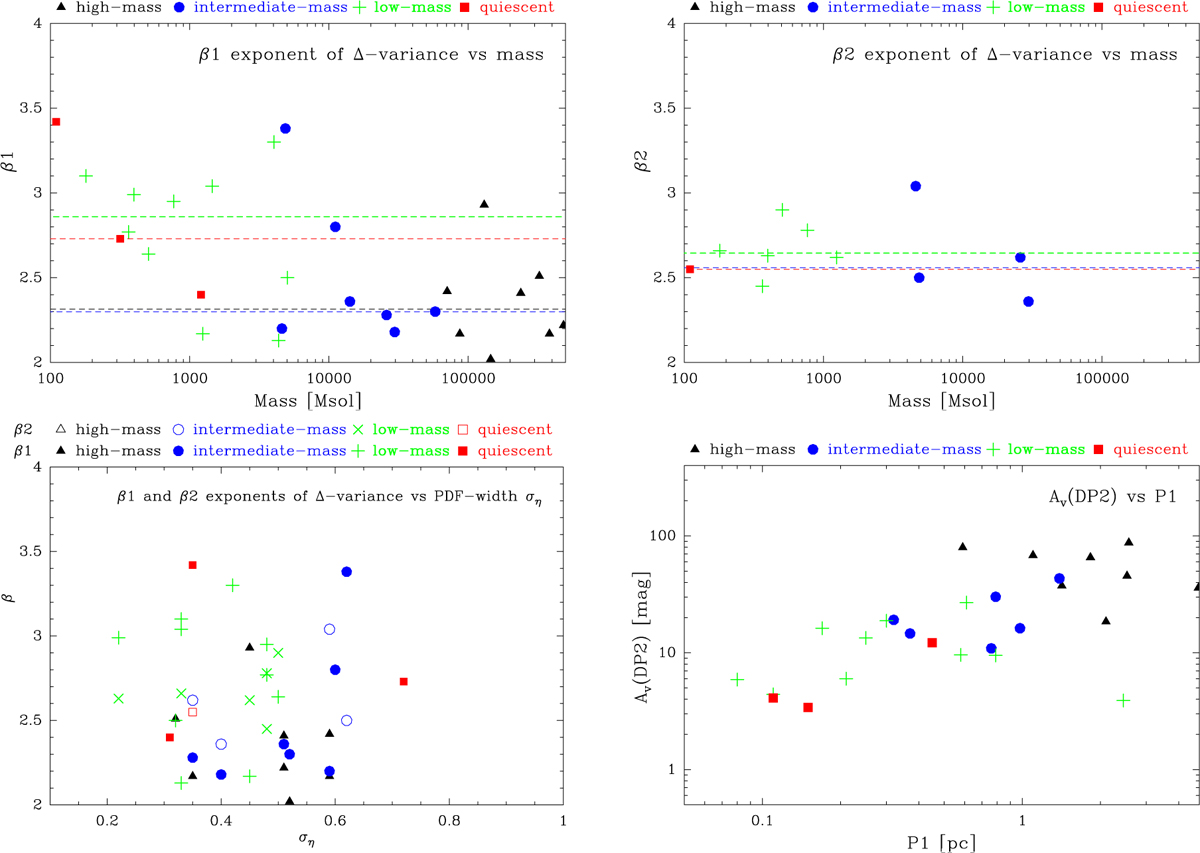
Fig. E.3
Download original image
Correlation plots of β1 and β2 as a function of mass (top) as a proxy for the cloud type. The different cloud types are indicated with different colors and symbols. The median value for each cloud type is given in the respective color as a dashed line. The left bottom panel shows β1 and β2 against the width of the log-normal part of the N-PDF. The right bottom panel displays AV(DP2) against P1 and indicates the AV value where the slope change between first and second PLT in the N-PDF occurs, and the first characteristic size scale detected by the ∆-variance.
Current usage metrics show cumulative count of Article Views (full-text article views including HTML views, PDF and ePub downloads, according to the available data) and Abstracts Views on Vision4Press platform.
Data correspond to usage on the plateform after 2015. The current usage metrics is available 48-96 hours after online publication and is updated daily on week days.
Initial download of the metrics may take a while.