Fig. A.3
Download original image
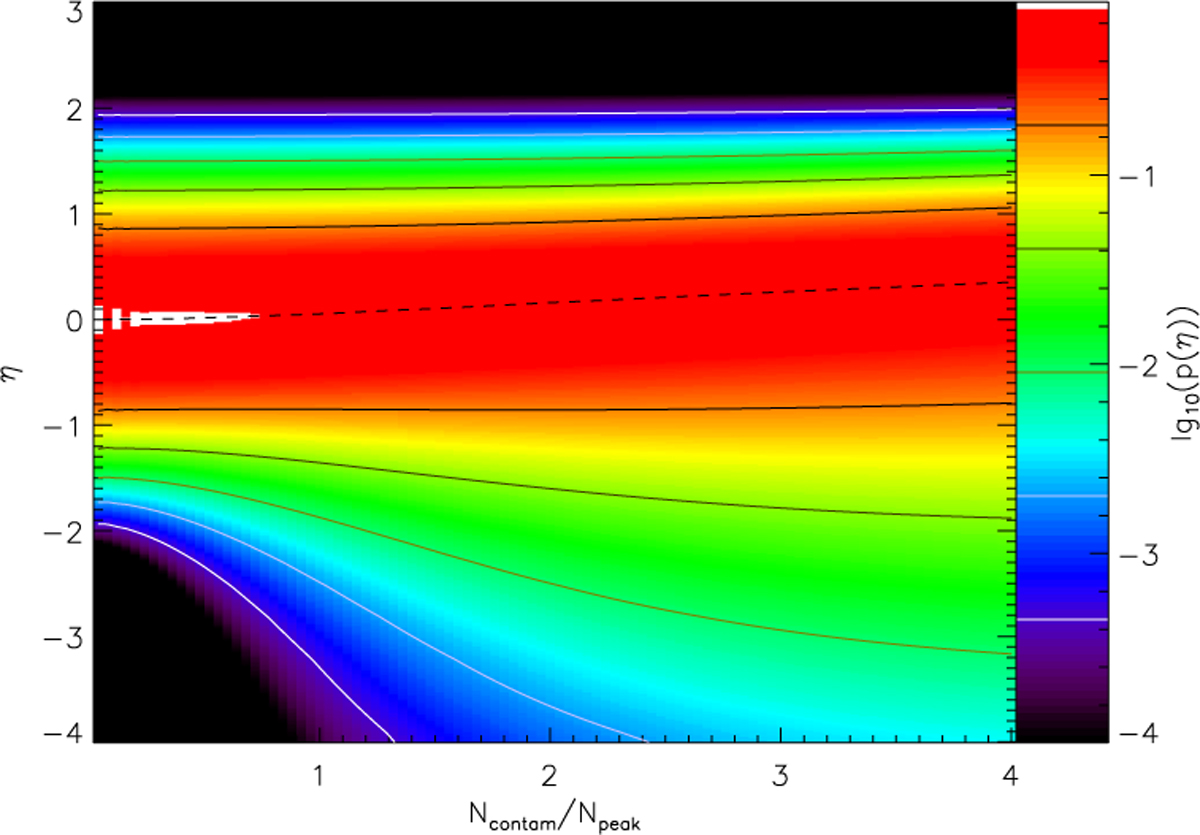
Two-dimensional representation of the N-PDFs of contaminated clouds after applying the constant screen correction as a function of the ratio between the contamination strength Ncontam and the typical cloud column density Npeak. The width of the cloud N-PDF was assumed to be ση,cloud = 0.5 and the width of the contamination ση,cont = 0.15, using some typical values for the clouds in this paper. The N-PDFs are represented through colors showing the logarithm.
Current usage metrics show cumulative count of Article Views (full-text article views including HTML views, PDF and ePub downloads, according to the available data) and Abstracts Views on Vision4Press platform.
Data correspond to usage on the plateform after 2015. The current usage metrics is available 48-96 hours after online publication and is updated daily on week days.
Initial download of the metrics may take a while.