Fig. D.1
Download original image
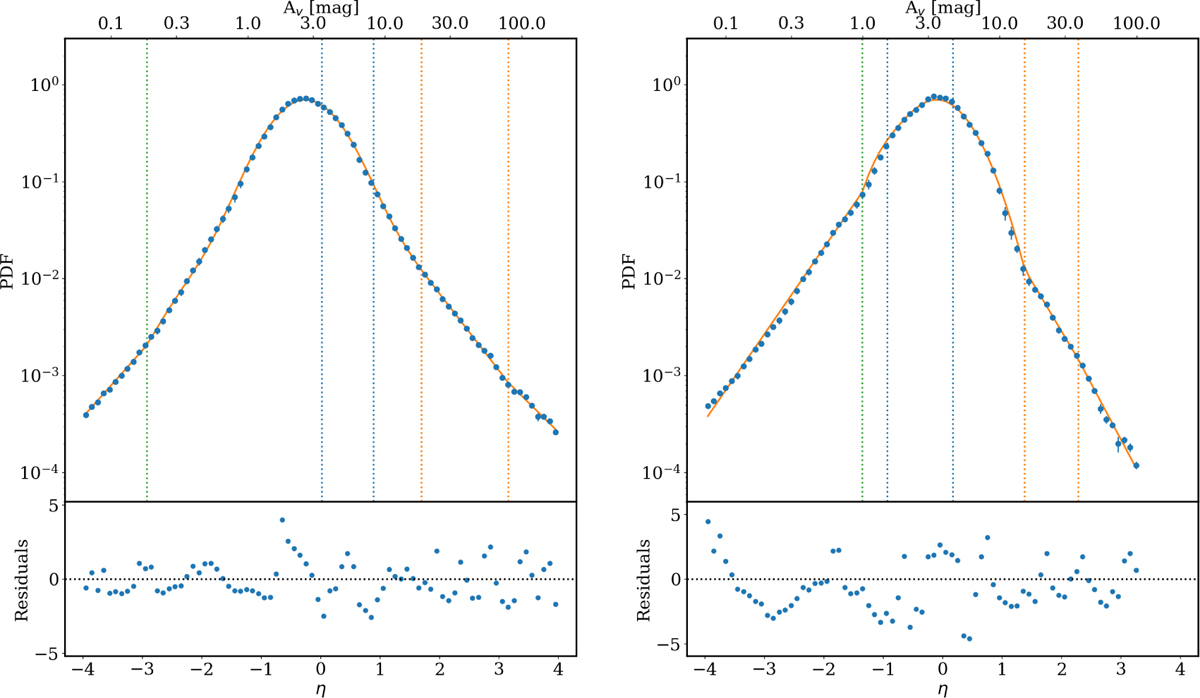
N-PDFs of LOS corrected column density (blue points), expressed in visual extinction (upper x-axis) and in η (lower x-axis) of DR21 (left) and DR15 (right). The left y-axis gives the PDF (there can be small differences compared to the plots in Appendix C because for the model fit, we excluded the extreme low- and high density ranges, which leads to a slightly different normalization). The orange curve indicates the best fitting model for the N-PDF (see Table B.1 and B.2). The vertical lines show the peak values of the log-normal(s) in blue, the break points for the power laws in orange and the error power law break point in green. Underneath is the standardized residuals, a perfect model would give numbers with mean of 0 and a variance of 1.
Current usage metrics show cumulative count of Article Views (full-text article views including HTML views, PDF and ePub downloads, according to the available data) and Abstracts Views on Vision4Press platform.
Data correspond to usage on the plateform after 2015. The current usage metrics is available 48-96 hours after online publication and is updated daily on week days.
Initial download of the metrics may take a while.