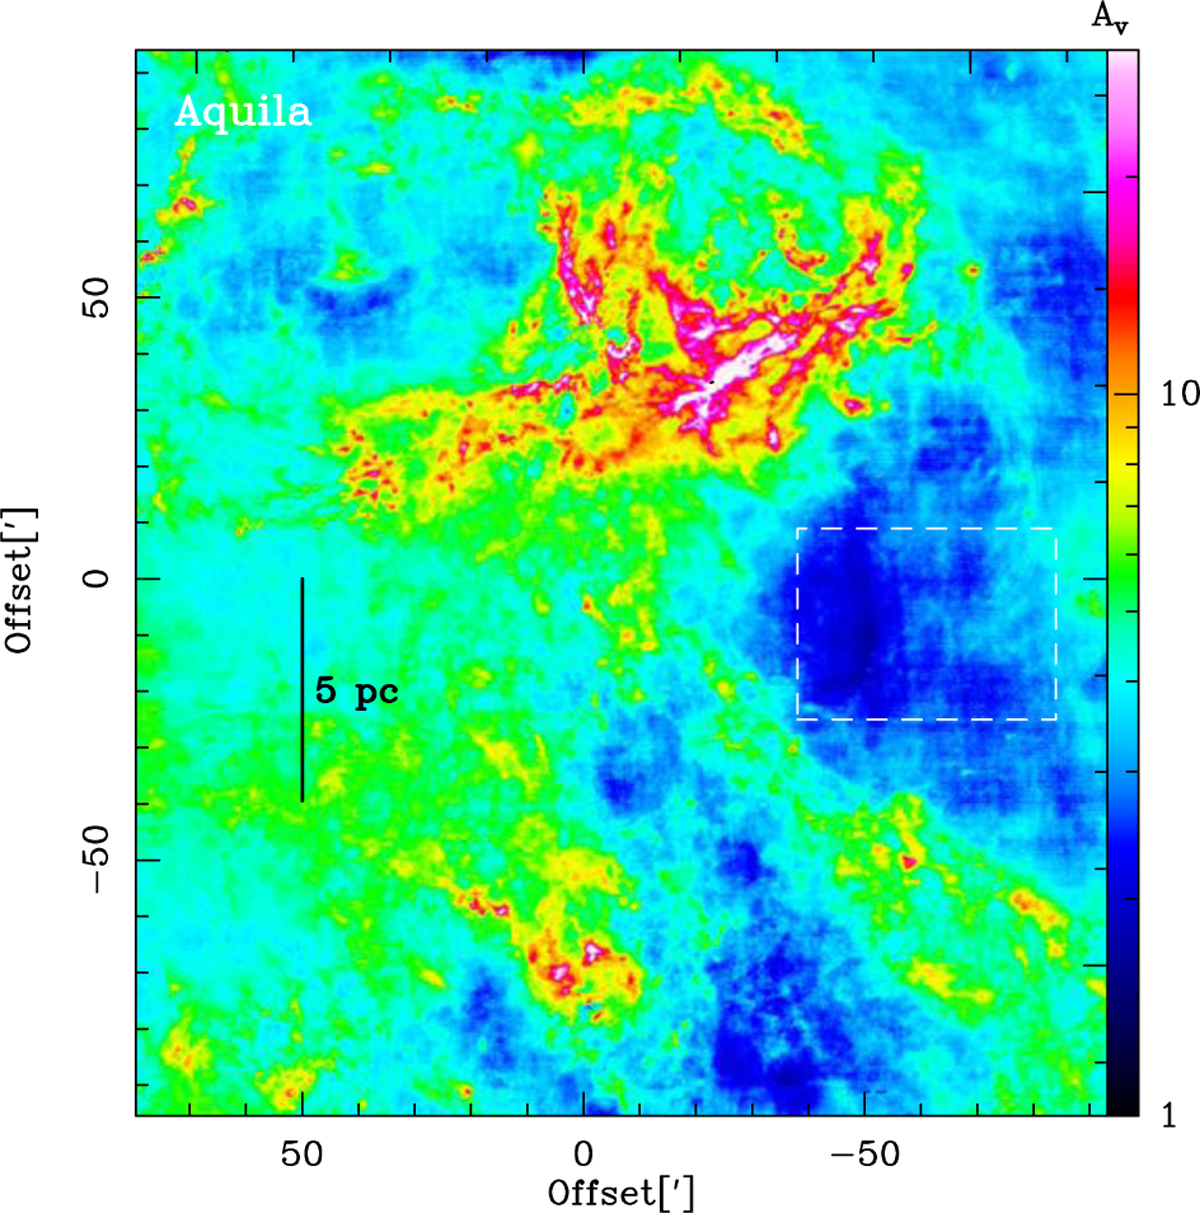
Fig. A.1
Download original image
LOS-uncorrected column density of the Aquila cloud expressed in visual extinction. The white dashed rectangle indicates the region used for evaluating the LOS-contamination by (i) taking the mean of all pixels inside the rectangle (AV = 2.5) and (ii) constructing an N-PDF from these pixels and determining the peak of the distribution (AV = 2.4, see Figure A.2).
Current usage metrics show cumulative count of Article Views (full-text article views including HTML views, PDF and ePub downloads, according to the available data) and Abstracts Views on Vision4Press platform.
Data correspond to usage on the plateform after 2015. The current usage metrics is available 48-96 hours after online publication and is updated daily on week days.
Initial download of the metrics may take a while.