Fig. 1
Download original image
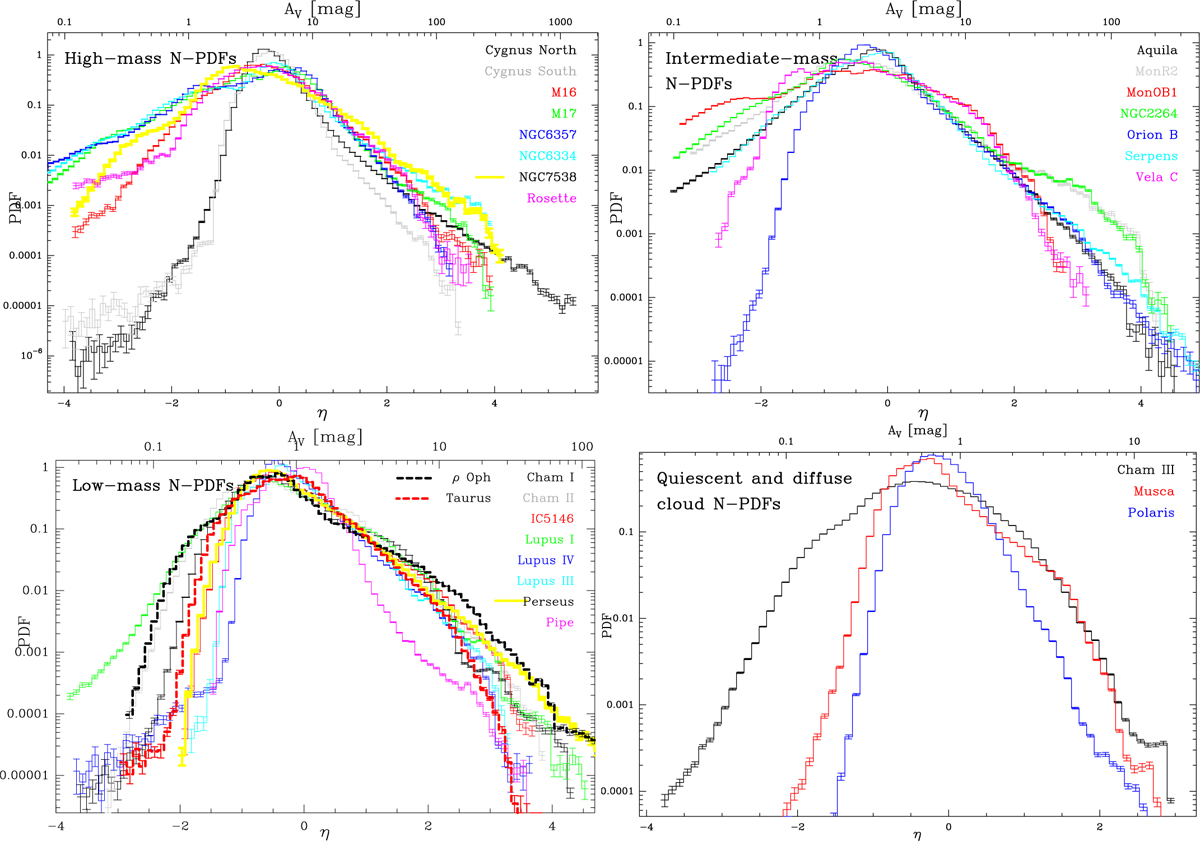
N-PDFs of all clouds ordered by cloud type, from high-mass and intermediate mass SF regions (top panels) to low-mass and quiescent regions (bottom panels). Each panel shows the N-PDFs for clouds in different colors. The column density is expressed in visual extinction (upper x-axis) and in η (lower x-axis). Error bars are calculated using Poisson statistics. For better visibility, we reduced the error bars by a factor of 2 (see figures in Appendix C for plots with the full error bars). We note that recently, a more sophisticated method was proposed by Jaupart & Chabrier (2022) to derive the statistical error bars of PDFs employing the autocovariance function.
Current usage metrics show cumulative count of Article Views (full-text article views including HTML views, PDF and ePub downloads, according to the available data) and Abstracts Views on Vision4Press platform.
Data correspond to usage on the plateform after 2015. The current usage metrics is available 48-96 hours after online publication and is updated daily on week days.
Initial download of the metrics may take a while.