Open Access
Fig. 4.
Download original image
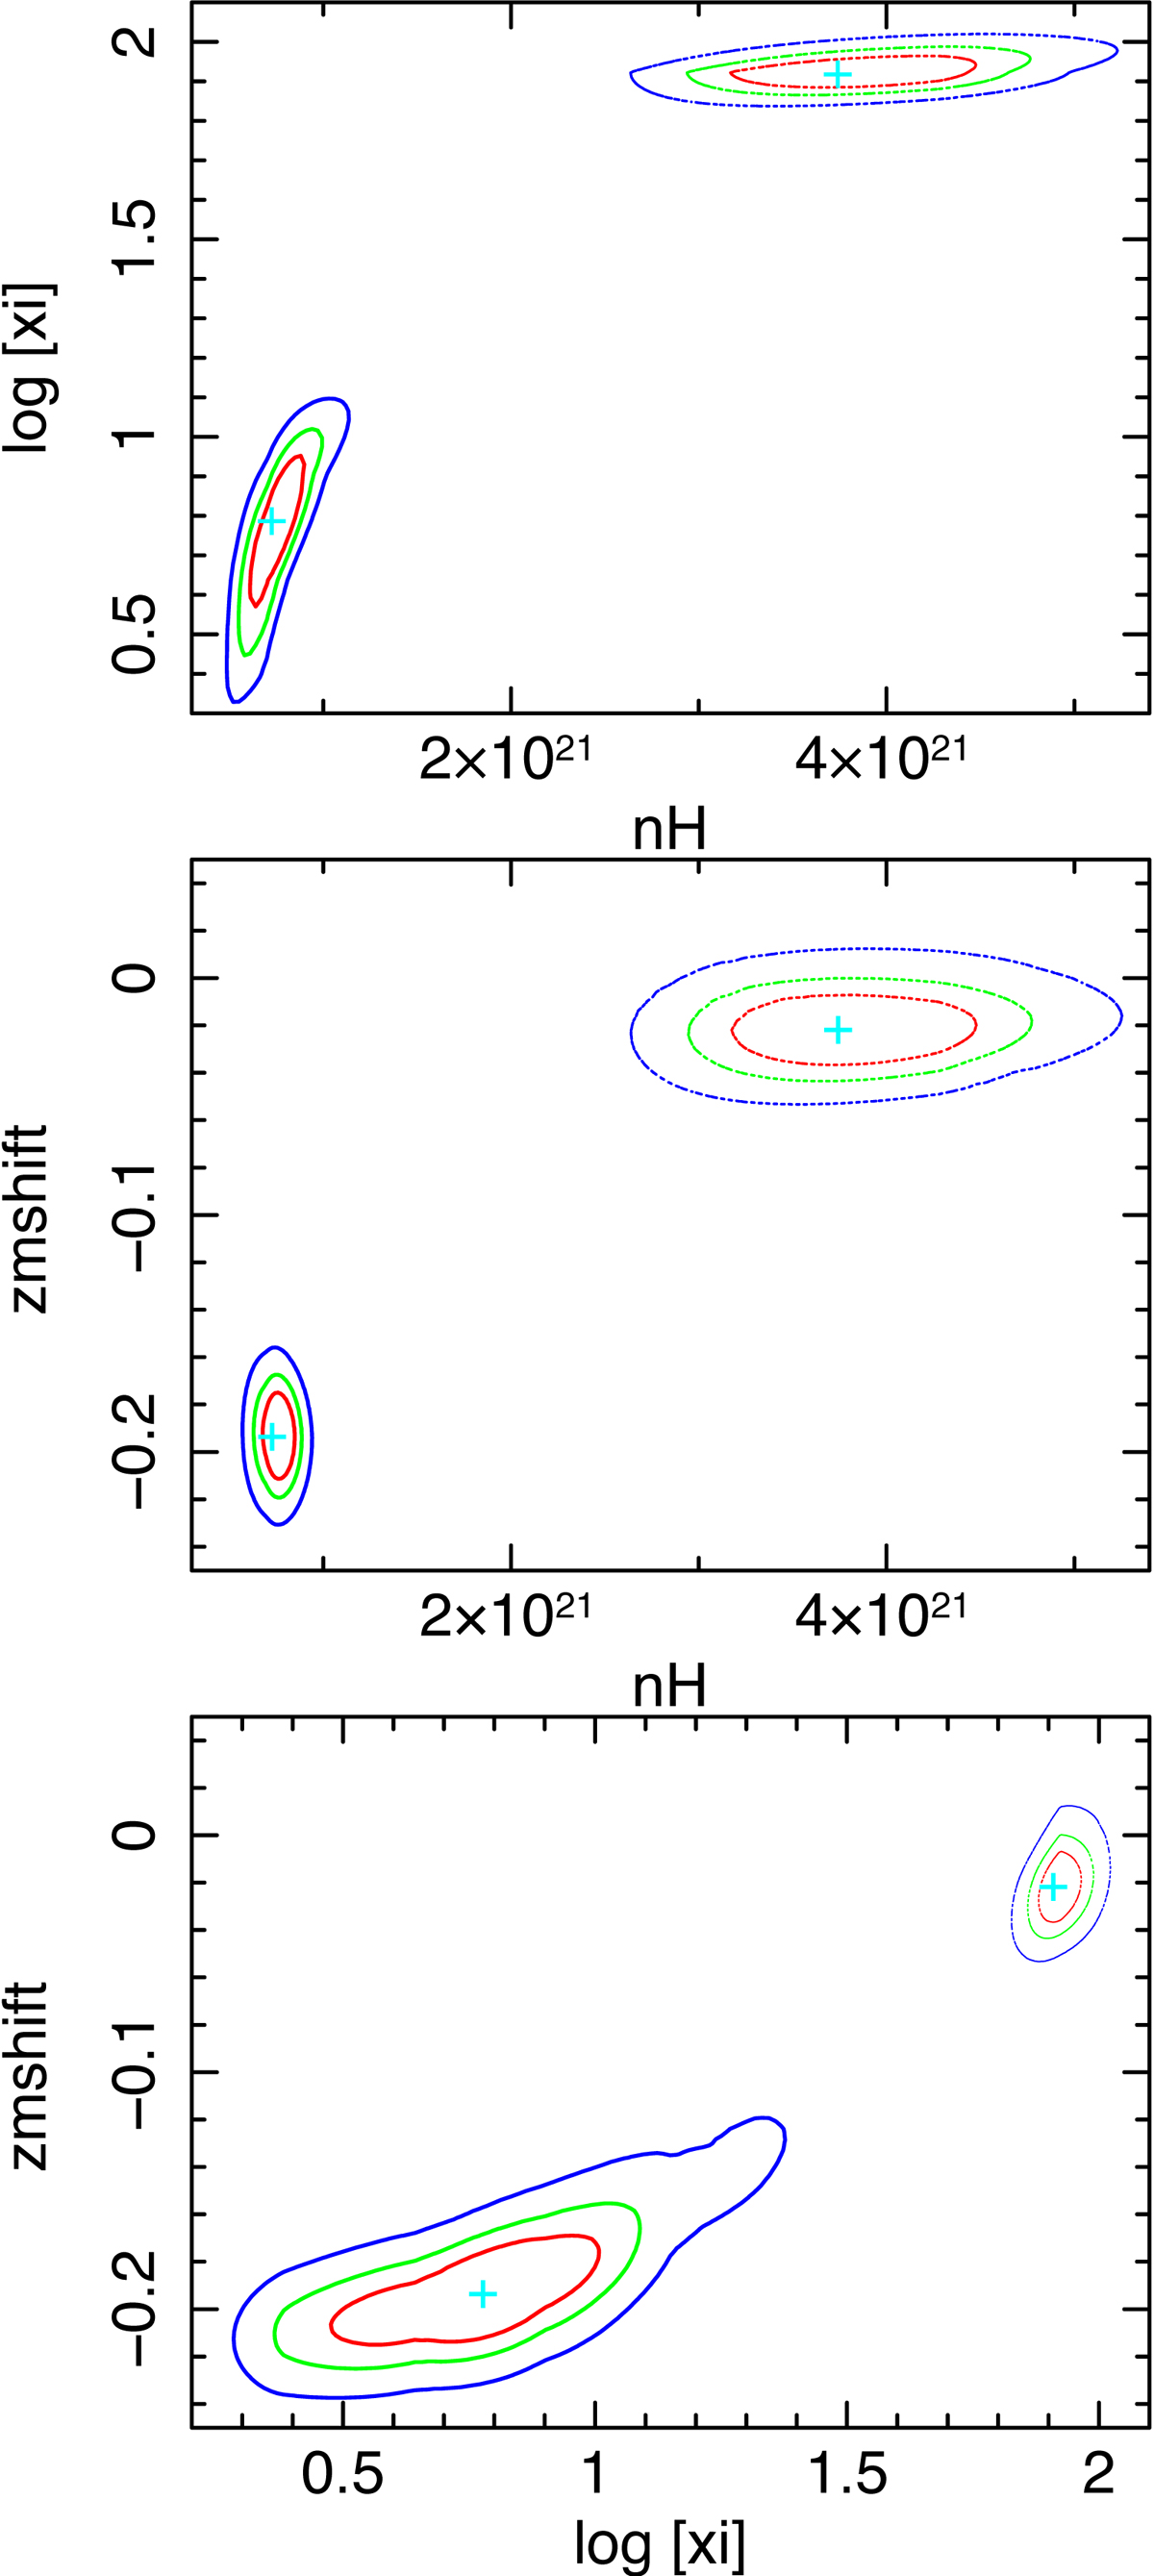
Contour plots for the parameters of the warm absorber. The red, green, and blue line represent the 1σ (68%), 2σ (95%), and 3σ (99.7%) confidence levels, respectively. The bottom left is for xmm_obs1, while the top right is for xmm_obs2 in each panel.
Current usage metrics show cumulative count of Article Views (full-text article views including HTML views, PDF and ePub downloads, according to the available data) and Abstracts Views on Vision4Press platform.
Data correspond to usage on the plateform after 2015. The current usage metrics is available 48-96 hours after online publication and is updated daily on week days.
Initial download of the metrics may take a while.