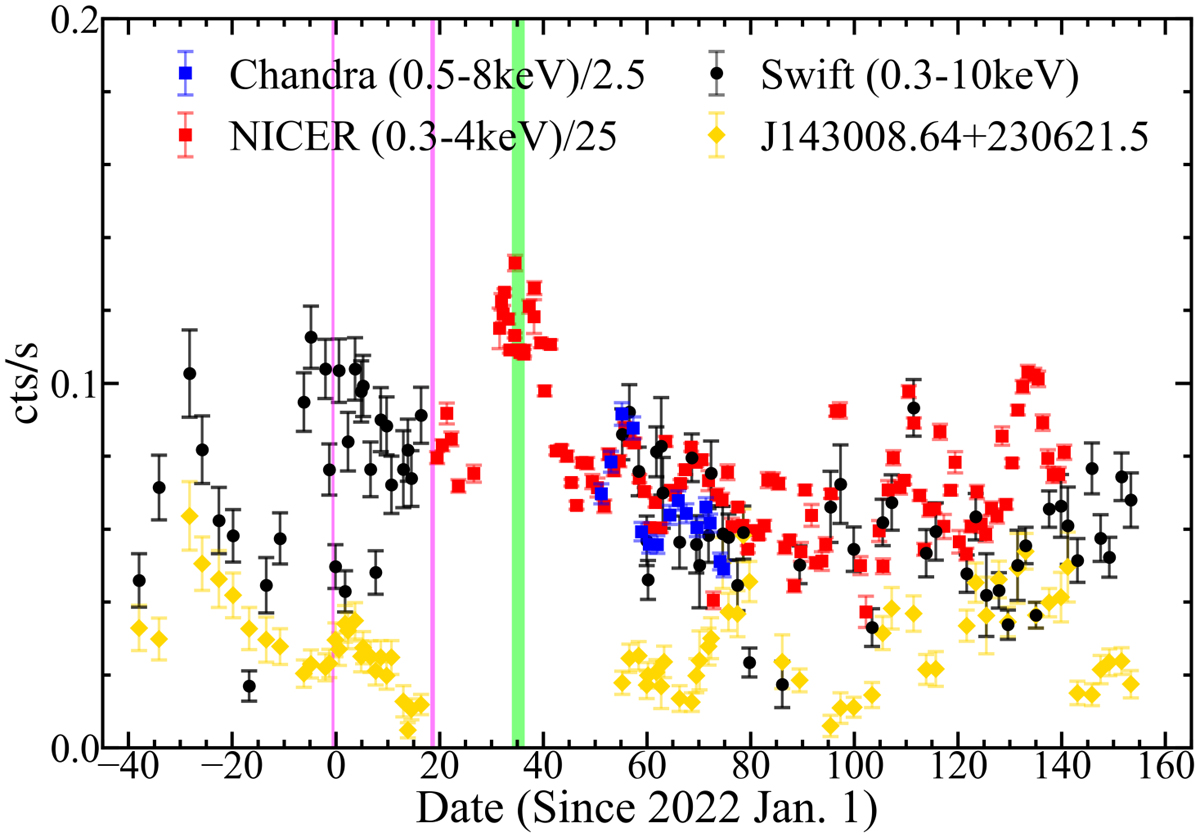
Fig. 1.
Download original image
Long-term X-ray light curves of SDSSJ1430+2303 since the Swift monitoring campaign. The count rates from Swift, Chandra, and NICER are shown with black dots and blue and red squares, respectively, which have been normalized in the overlapped time range. The Swift light curve of the nearby quasar, which has contaminated the NICER measurement, is also overplotted with yellow diamonds. We have also denoted the XMM-Newton and NuSTAR observing period with magenta and green vertical shadow regions.
Current usage metrics show cumulative count of Article Views (full-text article views including HTML views, PDF and ePub downloads, according to the available data) and Abstracts Views on Vision4Press platform.
Data correspond to usage on the plateform after 2015. The current usage metrics is available 48-96 hours after online publication and is updated daily on week days.
Initial download of the metrics may take a while.