Fig. 3.
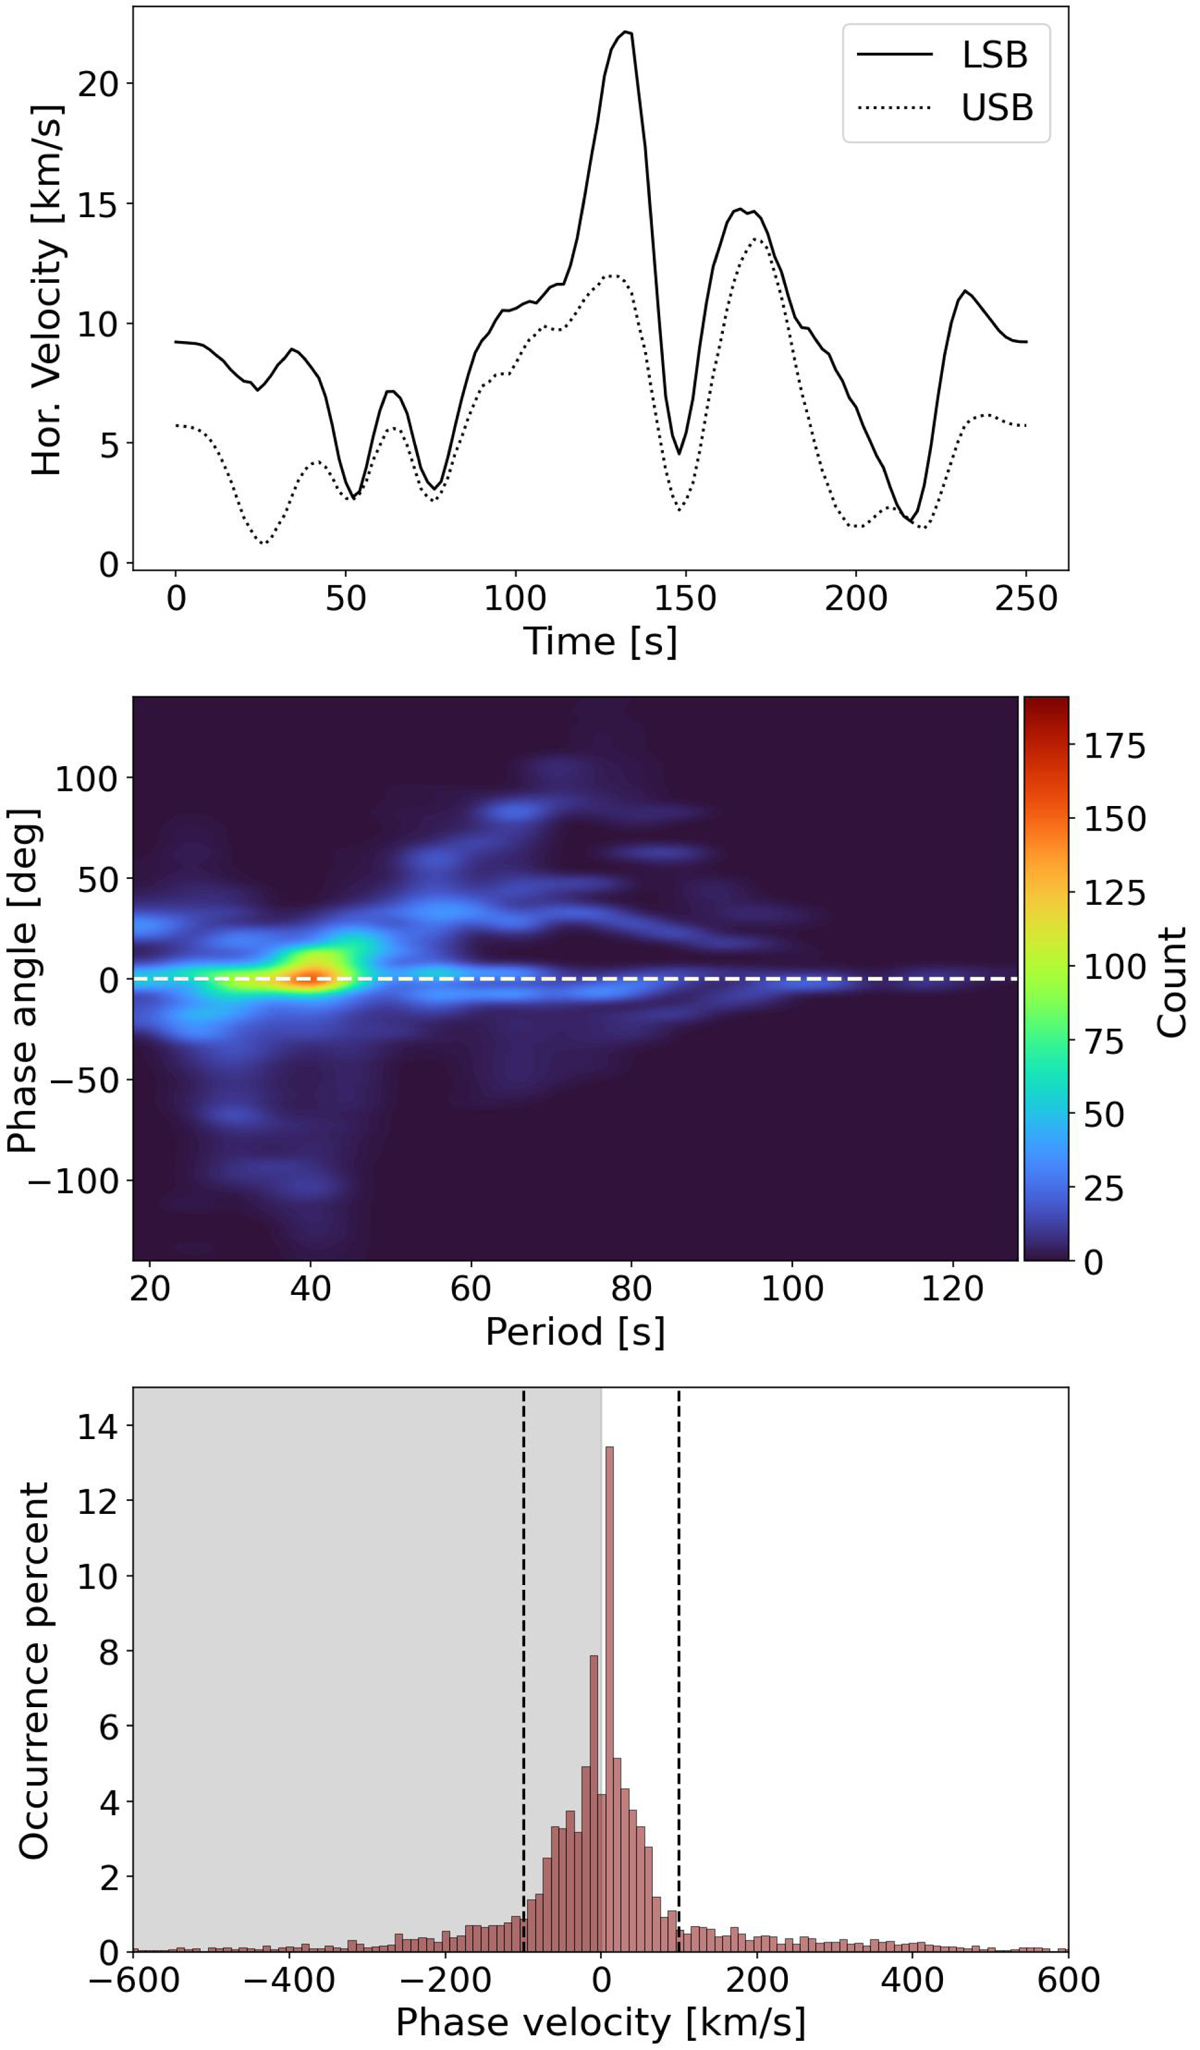
Download original image
Propagation of transverse waves between sidebands. Top: horizontal velocity for the bright feature enclosed in a square in Fig. 1. Middle: phase diagram as a 2D histogram of phase angle vs. periods of the horizontal velocity oscillations in the five small bright features (see blue crosses in Fig. 1) observed simultaneously in the LSB and the USB. Positive and negative phase angles represent upward and downward propagation in the Solar chromosphere, respectively. Bottom: histogram showing the calculated phase velocities for the waves present in the five analysed features, with a bin width of 10 km s−1.
Current usage metrics show cumulative count of Article Views (full-text article views including HTML views, PDF and ePub downloads, according to the available data) and Abstracts Views on Vision4Press platform.
Data correspond to usage on the plateform after 2015. The current usage metrics is available 48-96 hours after online publication and is updated daily on week days.
Initial download of the metrics may take a while.