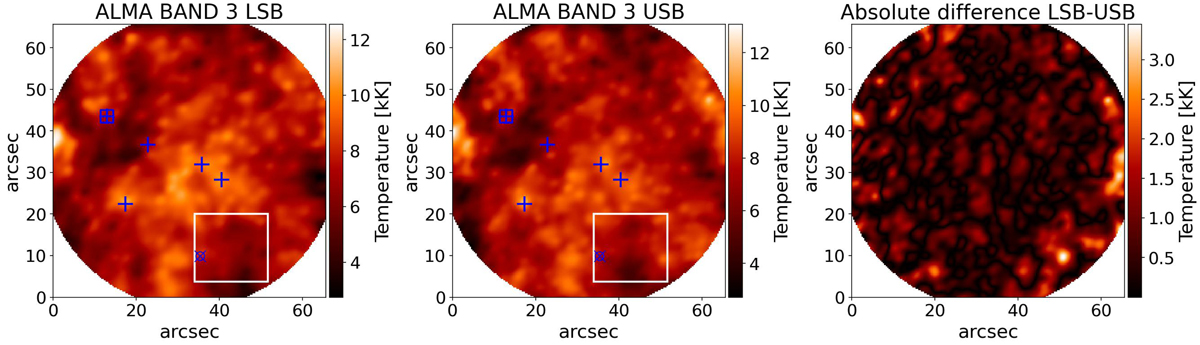
Fig. 1.
Download original image
Same time frame for ALMA lower sideband LSB (left) and upper sideband USB (middle) and the absolute difference between the two sidebands (right). The white box depicts a relatively quiet region of the field of view. The blue crosses mark the location of five bright features analysed in here and the cross enclosed by the blue square marks the location of the feature whose transverse oscillation has been shown in Fig. 3. The blue crossed circle marks the pixel shown in Fig. 2.
Current usage metrics show cumulative count of Article Views (full-text article views including HTML views, PDF and ePub downloads, according to the available data) and Abstracts Views on Vision4Press platform.
Data correspond to usage on the plateform after 2015. The current usage metrics is available 48-96 hours after online publication and is updated daily on week days.
Initial download of the metrics may take a while.