Fig. 6
Download original image
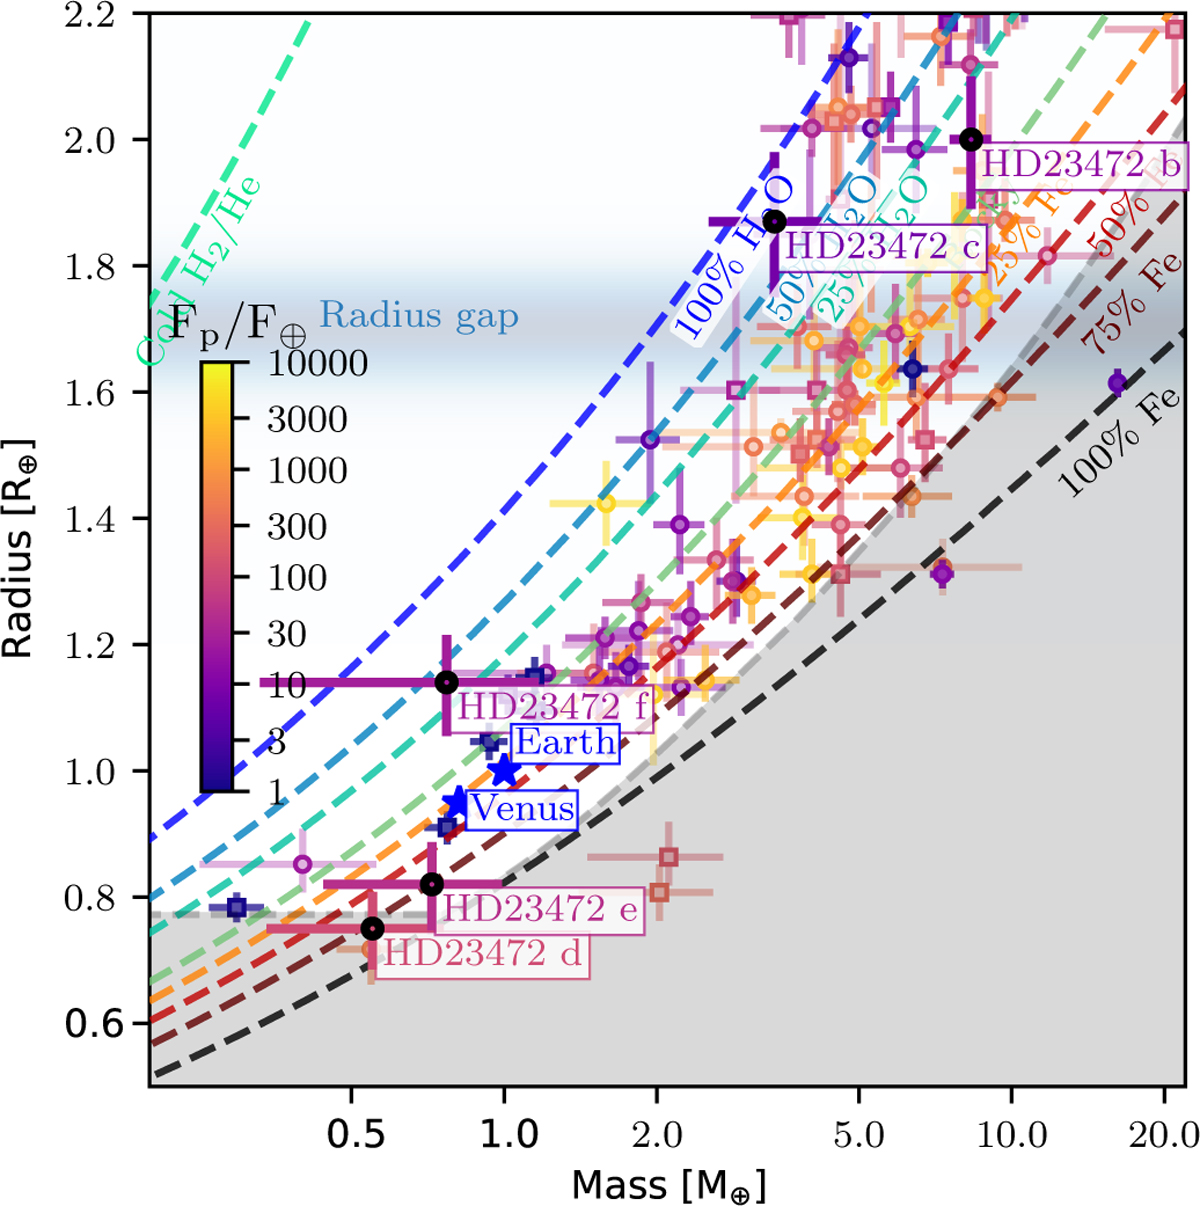
HD 23472 planets in the context of other known transiting planets with measured mass and radius precision better than 50%. The exoplanets data have been extracted from the NASA exoplanet archive. Planets whose masses were determined using the RV technique are represented as circles, whereas planets whose masses were determined using transit timing variations are represented as squares. The intensity of the incident flux is indicated by the colour of the points. The planetary bulk density’s relative precision is proportional to the transparency of the error bars. The planets of the solar system are illustrated as blue stars. We also show the mass-radius models of Zeng et al. (2016) as dashed lines. The radius gap (Fulton et al. 2017) is shown as a shaded horizontal blue line and the maximum collision stripping of the mantle region is shown in grey. This graph was created using the mass radius diagram code (https://github.com/odemangeon/mass-radius_diagram).
Current usage metrics show cumulative count of Article Views (full-text article views including HTML views, PDF and ePub downloads, according to the available data) and Abstracts Views on Vision4Press platform.
Data correspond to usage on the plateform after 2015. The current usage metrics is available 48-96 hours after online publication and is updated daily on week days.
Initial download of the metrics may take a while.