Fig. 3
Download original image
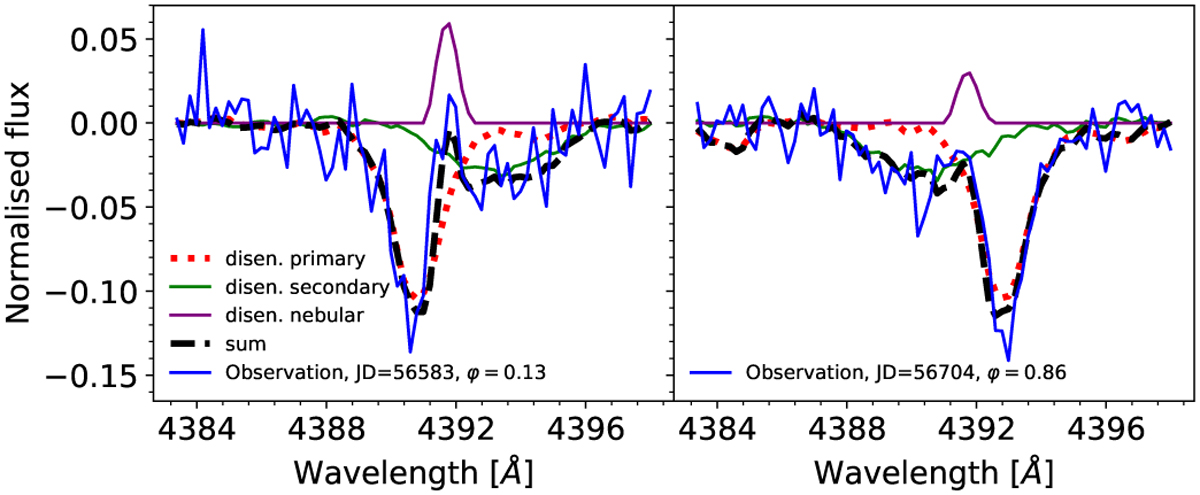
Disentangling of the He I λ4388 line of VFTS 350. Shown are the normalised spectra of VFTS 350, vertically shifted by −1, at RV extremes (phases φ = 0.13 and 0.86, left and right panels, noisy blue line), compared to the disentangled spectrum of the primary (dotted red line), secondary (solid green line), nebula (solid purple line), and their sum (dashed black line). Dates in the legend are given as JD − 2 400 000. The disentangling is performed for the derived K1 = 70 km s−1 and K2 = 91 km s−1 (see text). The disentangled spectra are not scaled by the light ratio in this plot.
Current usage metrics show cumulative count of Article Views (full-text article views including HTML views, PDF and ePub downloads, according to the available data) and Abstracts Views on Vision4Press platform.
Data correspond to usage on the plateform after 2015. The current usage metrics is available 48-96 hours after online publication and is updated daily on week days.
Initial download of the metrics may take a while.