Fig. 11
Download original image
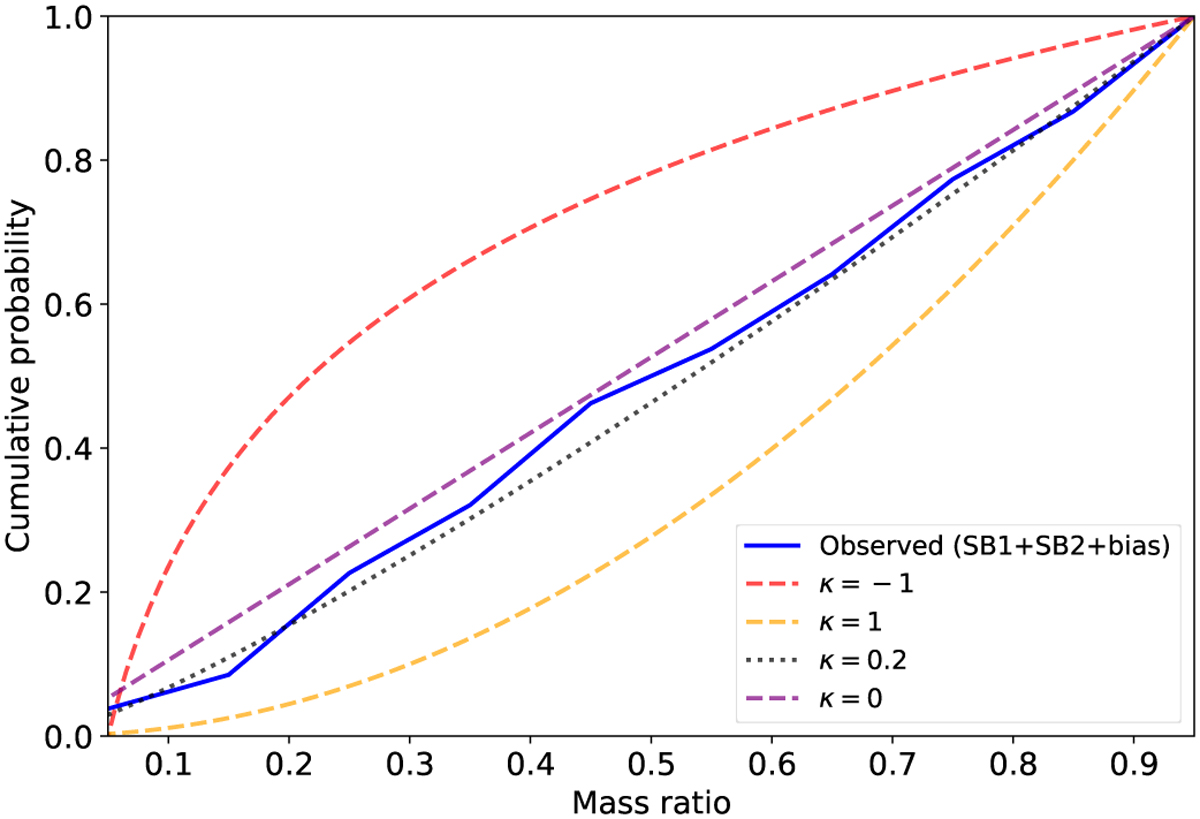
Cumulative distribution of the mass ratios measured for the SB2 and SB1 population, including bias-correction due to the finite binary detection probability (see text for details), defined in the bins 0.05, 0.15, …, 0.95 (each representing an interval of ∆q = 0.1). The distribution is compared to cumulative functions obtained for κ = −1,0,0.2, and 1, defined in the interval 0.0 < q ≤ 0.95, except for the κ = −1 case, which is defined for 0.05 ≤ q ≤ 0.95 to avoid a singularity. Evidently, the observed distribution closely follows a flat mass-ratio κ = 0 (uniform).
Current usage metrics show cumulative count of Article Views (full-text article views including HTML views, PDF and ePub downloads, according to the available data) and Abstracts Views on Vision4Press platform.
Data correspond to usage on the plateform after 2015. The current usage metrics is available 48-96 hours after online publication and is updated daily on week days.
Initial download of the metrics may take a while.