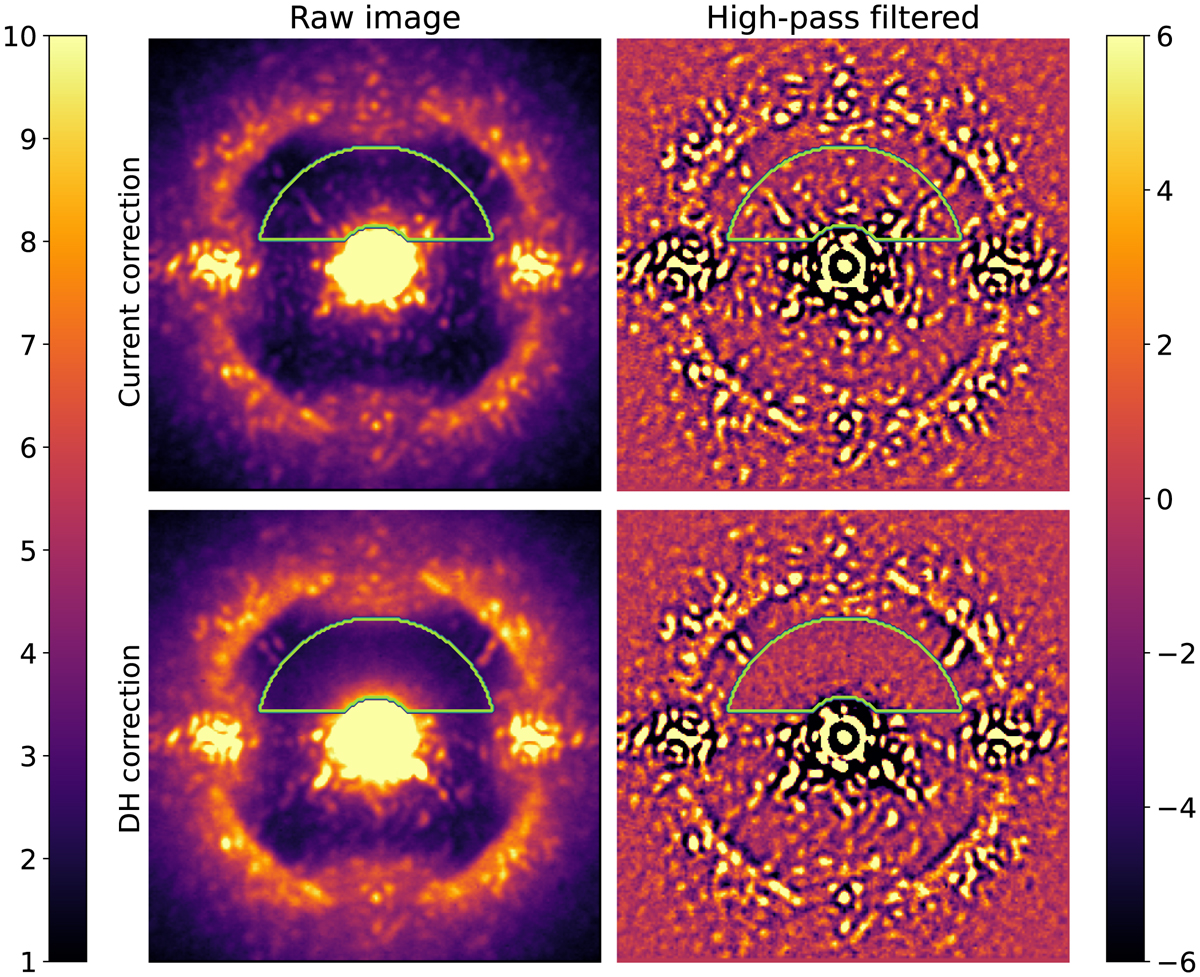
Fig. 1
Download original image
Normalized intensity images in linear scale obtained before (top row) and after (bottom row) the on-sky DH correction. Left column: Raw image with bad pixels removed. Right column: Same as for the left column, but high-pass filtered using a Gaussian kernel with a standard deviation of 0.57λ0/D. The images are normalized by the maximum of the off-axis PSF, and multiplied by 105 and 106 for the left and right images, respectively. The corrected region is encircled in green.
Current usage metrics show cumulative count of Article Views (full-text article views including HTML views, PDF and ePub downloads, according to the available data) and Abstracts Views on Vision4Press platform.
Data correspond to usage on the plateform after 2015. The current usage metrics is available 48-96 hours after online publication and is updated daily on week days.
Initial download of the metrics may take a while.