Fig. 4.
Download original image
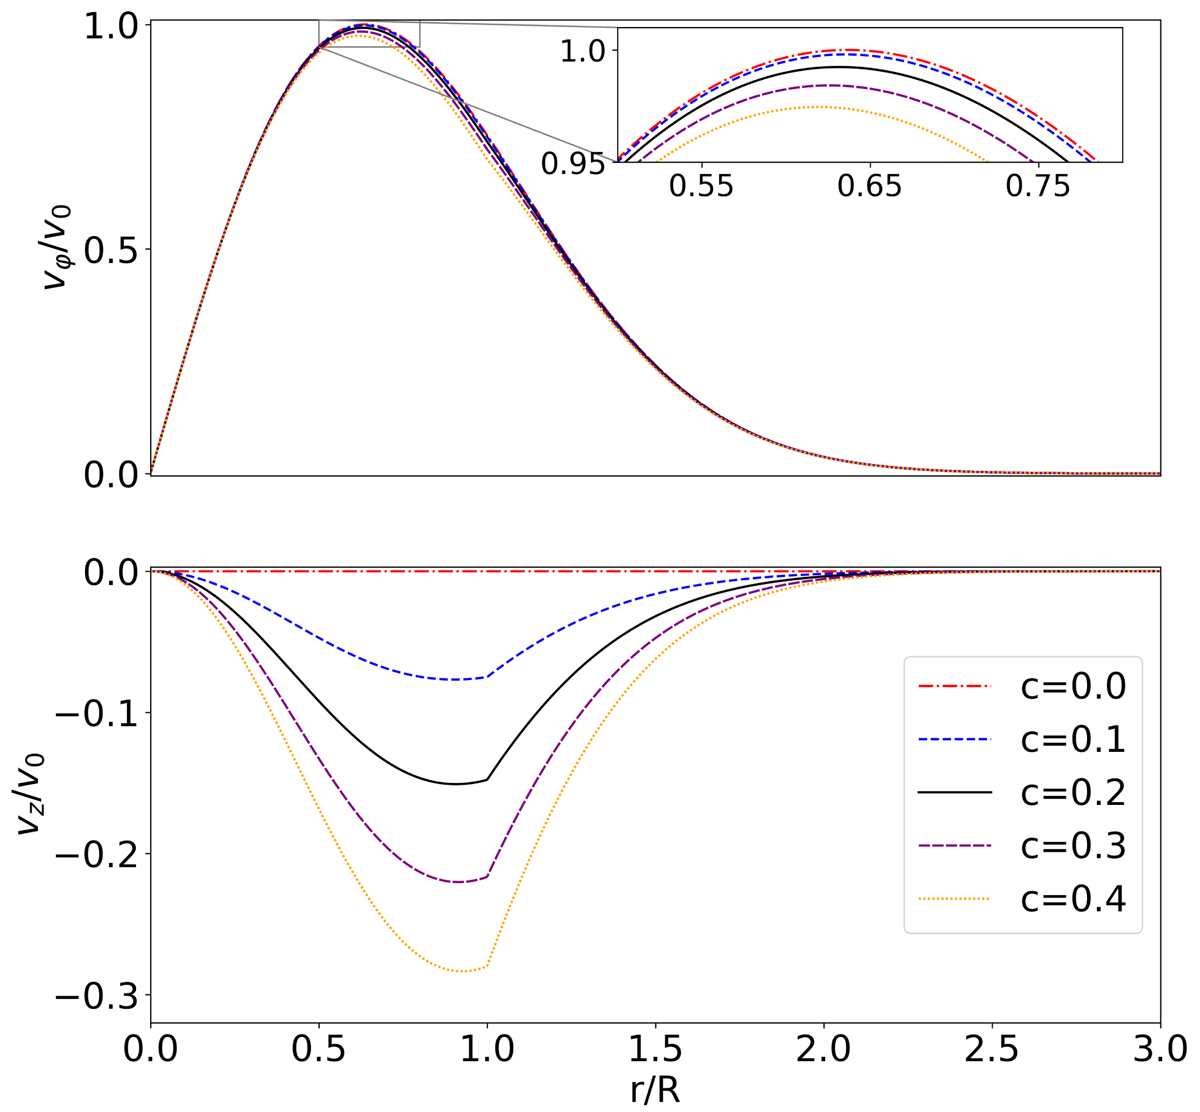
Radial profiles of the azimuthal (top) and longitudinal (bottom) velocity components at t = 0 for the twist parameter ranging from c = 0 to c = 0.4. The inset in the top panel shows a close-up view of the azimuthal velocity around its maximum. Both velocity components are normalized to the maximum amplitude of the perpendicular velocity perturbation, v0.
Current usage metrics show cumulative count of Article Views (full-text article views including HTML views, PDF and ePub downloads, according to the available data) and Abstracts Views on Vision4Press platform.
Data correspond to usage on the plateform after 2015. The current usage metrics is available 48-96 hours after online publication and is updated daily on week days.
Initial download of the metrics may take a while.