Open Access
Fig. 1.
Download original image
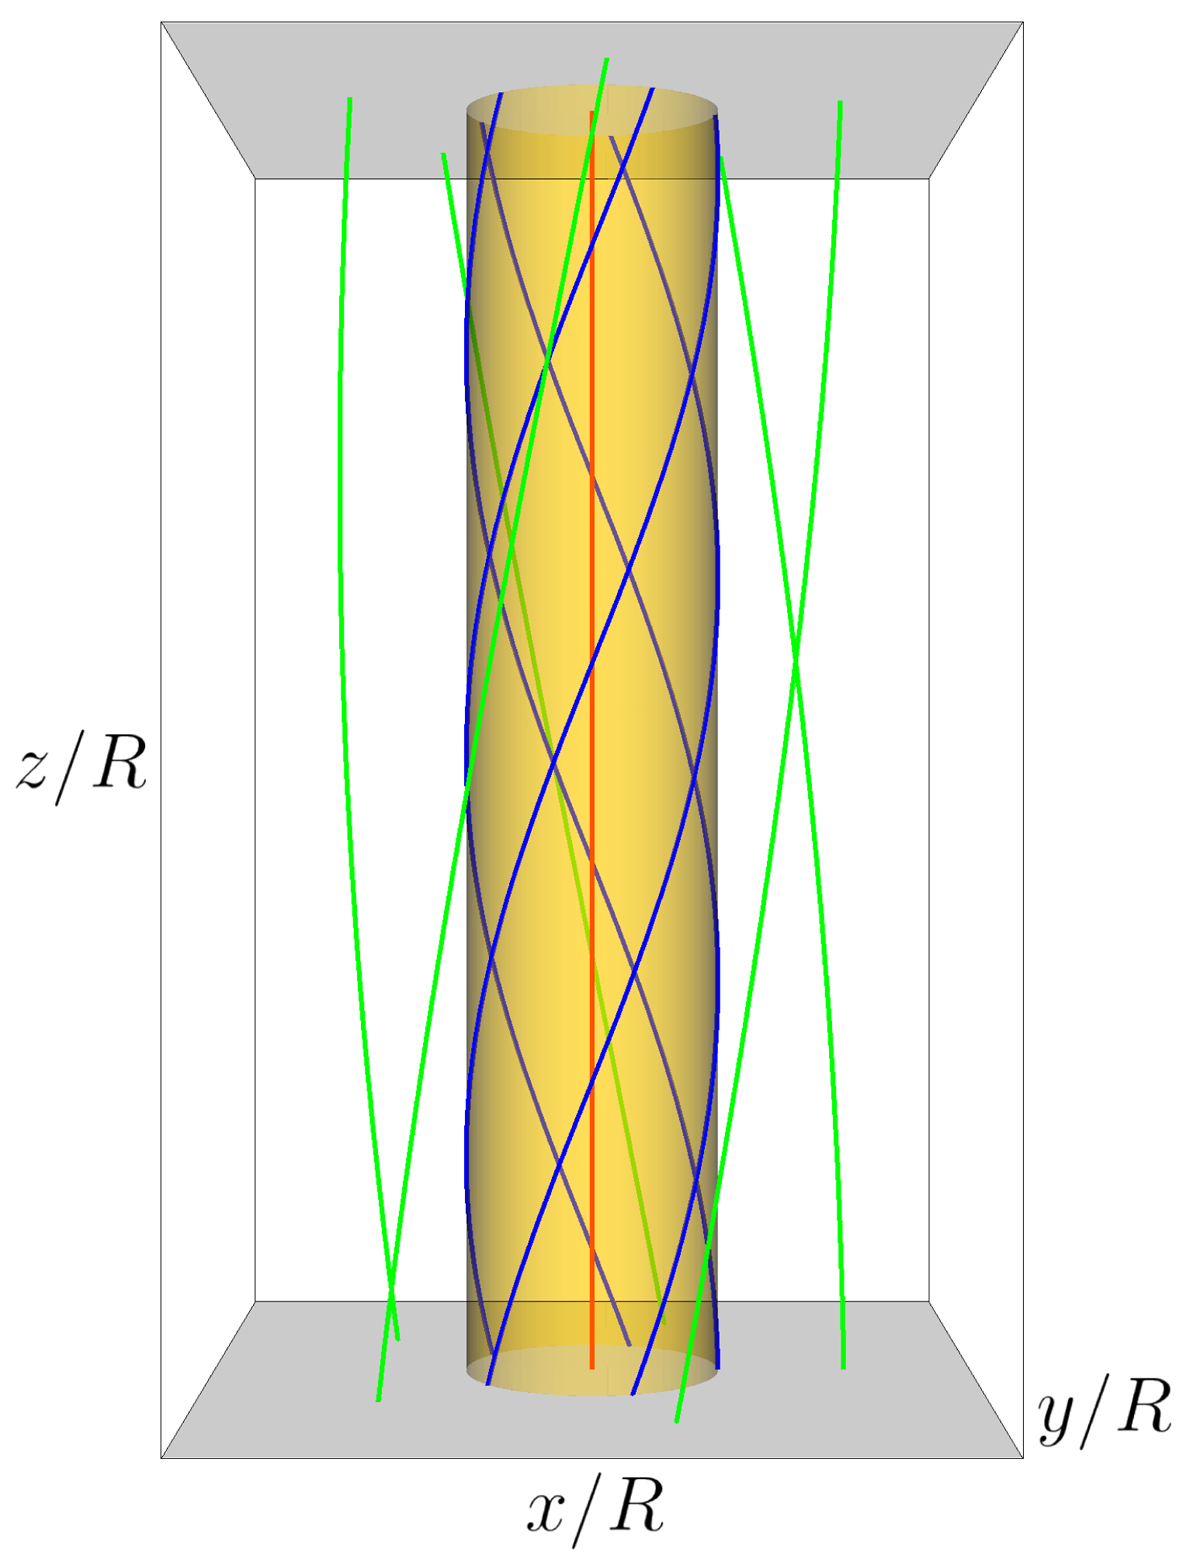
Sketch of the coronal flux-tube model. The isosurface of density with value equal to (ρi + ρe)/2 is shown in orange. Magnetic field lines located at r = 2R, r = R and r = 0 are drawn in green, blue, and red, respectively, for the model with c = 0.4. The bottom and top gray planes represent the solar photosphere.
Current usage metrics show cumulative count of Article Views (full-text article views including HTML views, PDF and ePub downloads, according to the available data) and Abstracts Views on Vision4Press platform.
Data correspond to usage on the plateform after 2015. The current usage metrics is available 48-96 hours after online publication and is updated daily on week days.
Initial download of the metrics may take a while.