Fig. 9.
Download original image
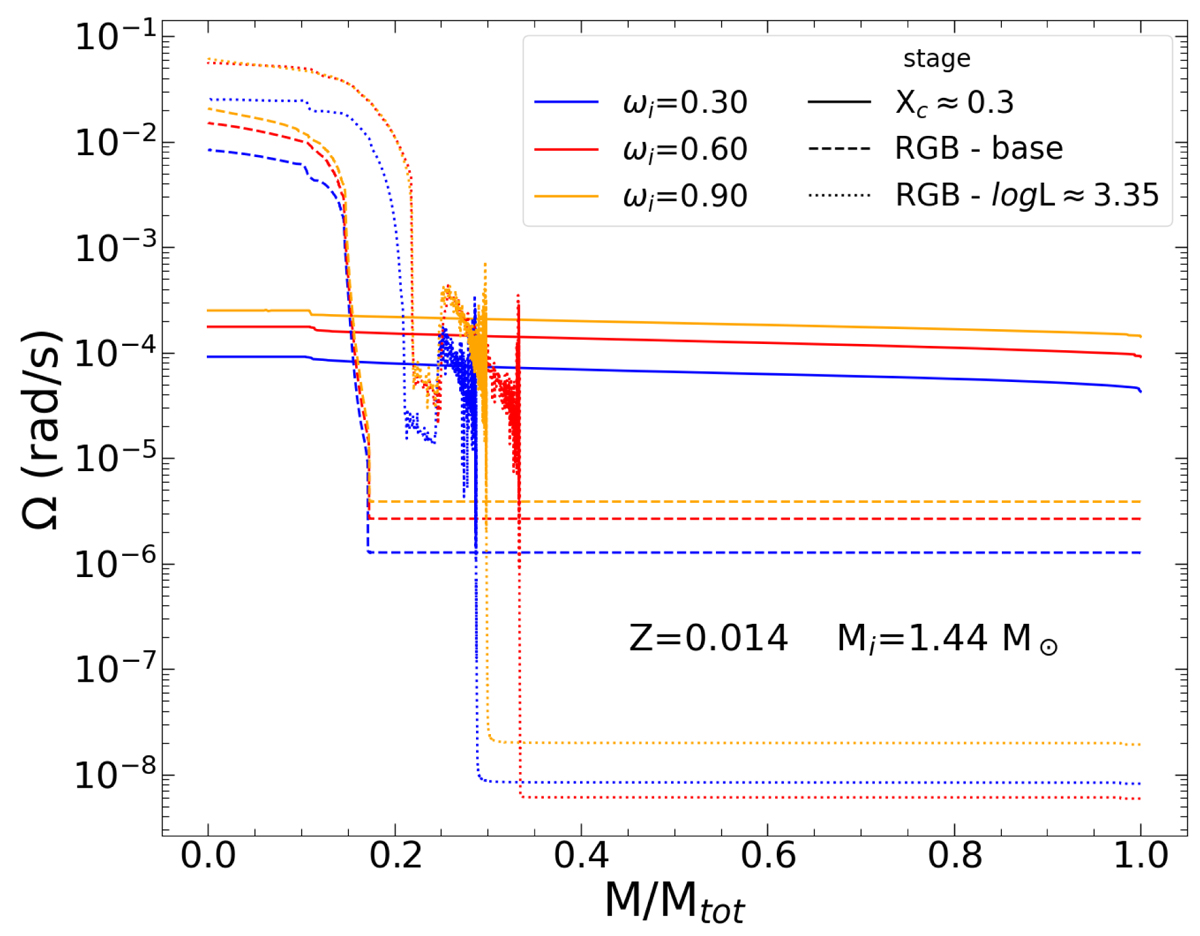
Internal distribution of angular velocity, Ω. Three selected stages of models with Z = 0.014, Mi = 1.44 M⊙ are presented: at which the central hydrogen Xc ≈ 0.3 during the MS (solid lines), at the base of the RGB phase (dashed lines), and near the TRGB with log L ≈ 3.35 (dotted lines). The colours represent different selected initial rotation models.
Current usage metrics show cumulative count of Article Views (full-text article views including HTML views, PDF and ePub downloads, according to the available data) and Abstracts Views on Vision4Press platform.
Data correspond to usage on the plateform after 2015. The current usage metrics is available 48-96 hours after online publication and is updated daily on week days.
Initial download of the metrics may take a while.