Fig. 5.
Download original image
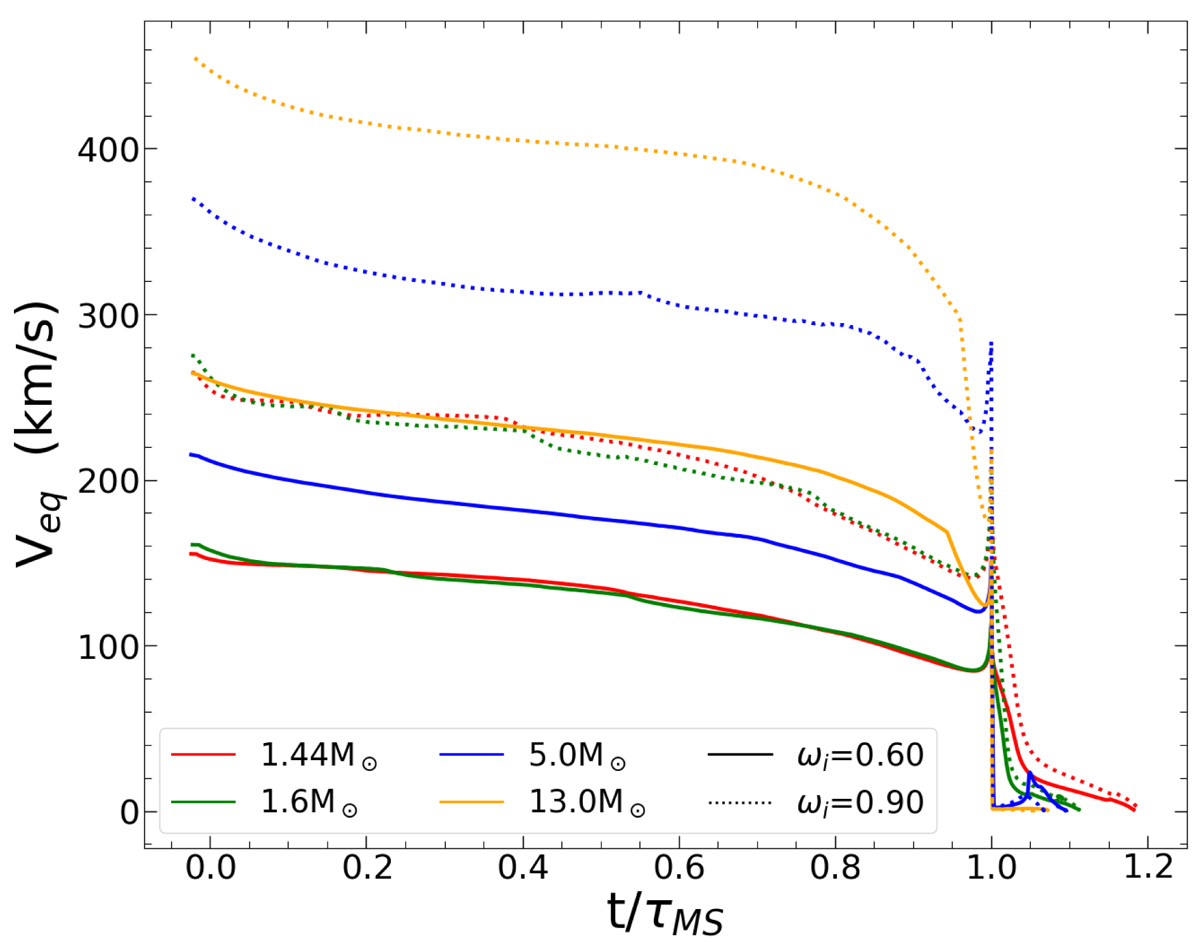
Evolution of surface tangential velocity at the equator, Veq, versus the time, t, scaled to the MS duration, τMS. The four selected mass models – 1.44 M⊙ (red), 1.6 M⊙ (green), 5 M⊙ (blue), and 13 M⊙ (orange) – are shown, with two initial rotation rates – ωi = 0.60 (solid line) and ωi = 0.90 (dotted line) – from the set with Z = 0.014, Y = 0.273.
Current usage metrics show cumulative count of Article Views (full-text article views including HTML views, PDF and ePub downloads, according to the available data) and Abstracts Views on Vision4Press platform.
Data correspond to usage on the plateform after 2015. The current usage metrics is available 48-96 hours after online publication and is updated daily on week days.
Initial download of the metrics may take a while.