Fig. 7
Download original image
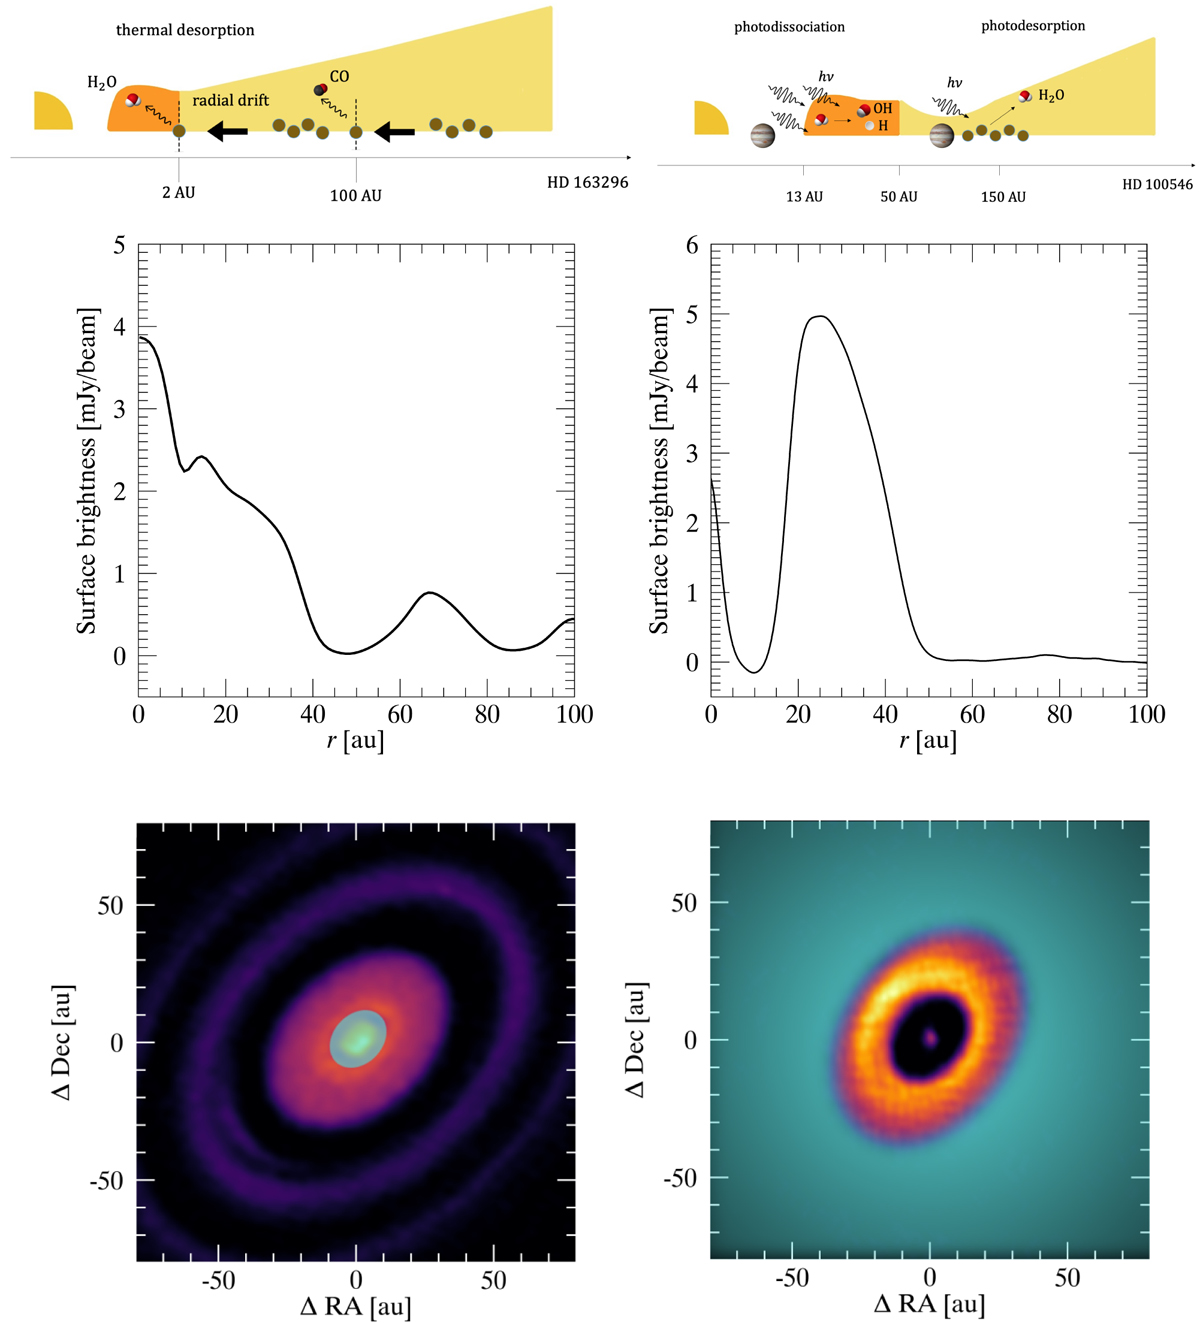
Top: schematic of the H2O distribution in the two discs. Middle: surface brightness profile (azimuthally averaged) of the milllmetre dust continuum at 1.2 mm for HD 163296 (from DSHARP survey, Andrews et al. 2018; Huang et al. 2018) and at 0.87 mm for HD 100546 (Pineda et al. 2019; Fedele et al. 2021) in the inner 100 au. Bottom: water-emitting region (cyan) overlaid on the ALMA dust continuum image. Notably in the case of HD 163296, the size of the H2O-emitting region corresponds to the narrow dust gap at 10 au. This may be due to dust growth at the border of the snow line.
Current usage metrics show cumulative count of Article Views (full-text article views including HTML views, PDF and ePub downloads, according to the available data) and Abstracts Views on Vision4Press platform.
Data correspond to usage on the plateform after 2015. The current usage metrics is available 48-96 hours after online publication and is updated daily on week days.
Initial download of the metrics may take a while.