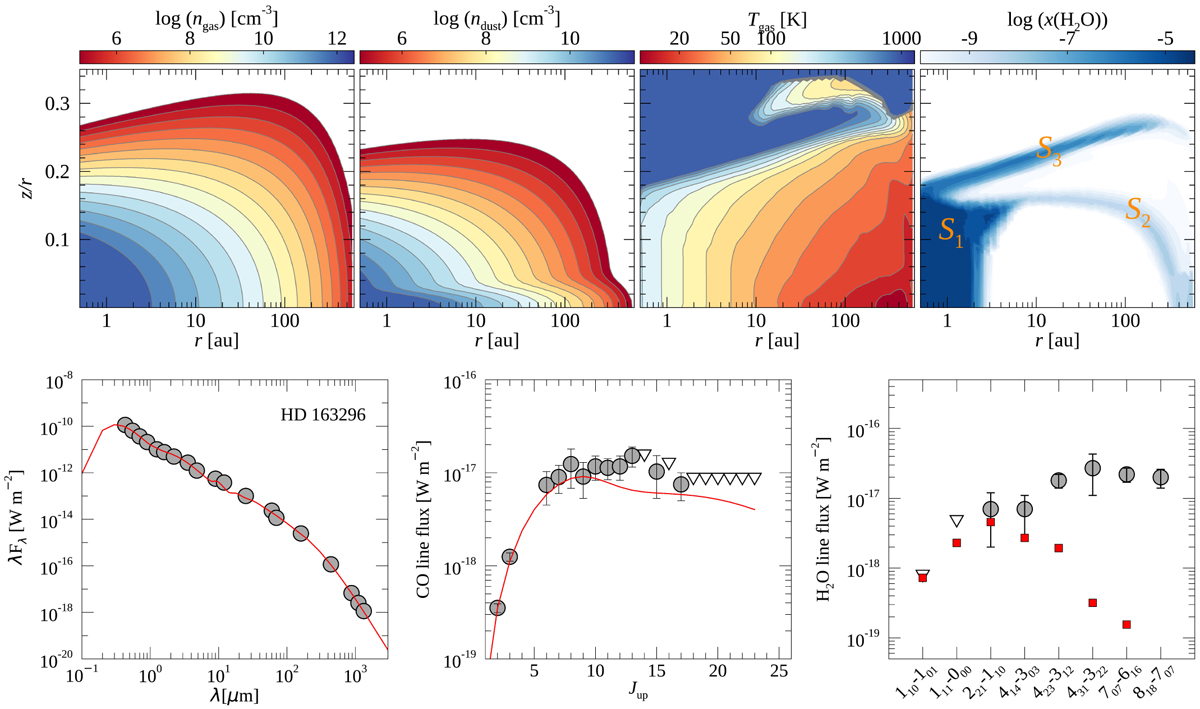
Fig. 3
Download original image
DALI disc structure for HD 163296. Top panels: gas and dust density structure, the gas temperature, and the H2O abundance structure. The three main H2O reservoirs are indicated by the labels s1, s2, and s3. Bottom panels: model predictions of the SED (left), CO ladder (middle), and H2O fluxes (right). The observed fluxes and 3σ upper µmits are shown as (grey) circles and open triangles, respectively. The representative model shown as a red line and red squares) reproduces the SED (left) and the CO rotational ladder (middle) well but is not able to reproduce the H2O line fluxes and upper µmits. We note that the H2O abundances shown here are those of the representative disc model based on the full gas-grain chemistry calculation.
Current usage metrics show cumulative count of Article Views (full-text article views including HTML views, PDF and ePub downloads, according to the available data) and Abstracts Views on Vision4Press platform.
Data correspond to usage on the plateform after 2015. The current usage metrics is available 48-96 hours after online publication and is updated daily on week days.
Initial download of the metrics may take a while.