Open Access
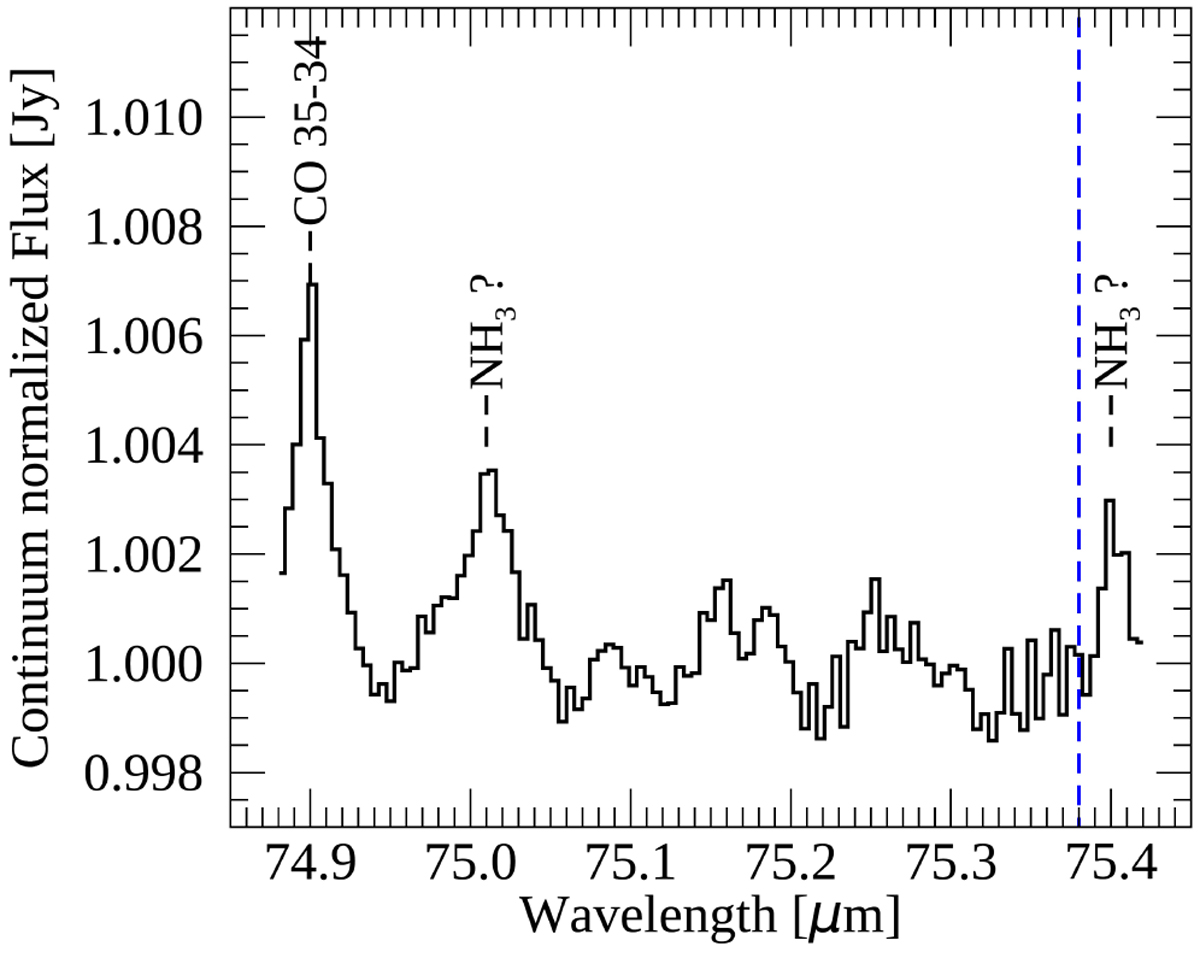
Fig. 1
Download original image
Herschel/PACS deep integration of HD 100546 at 75 µm. The CO J = 35–34 line is detected along with two other emission lines likely due to NH3. The blue dashed line indicates the position of the H2O 321 – 212 transition.
Current usage metrics show cumulative count of Article Views (full-text article views including HTML views, PDF and ePub downloads, according to the available data) and Abstracts Views on Vision4Press platform.
Data correspond to usage on the plateform after 2015. The current usage metrics is available 48-96 hours after online publication and is updated daily on week days.
Initial download of the metrics may take a while.