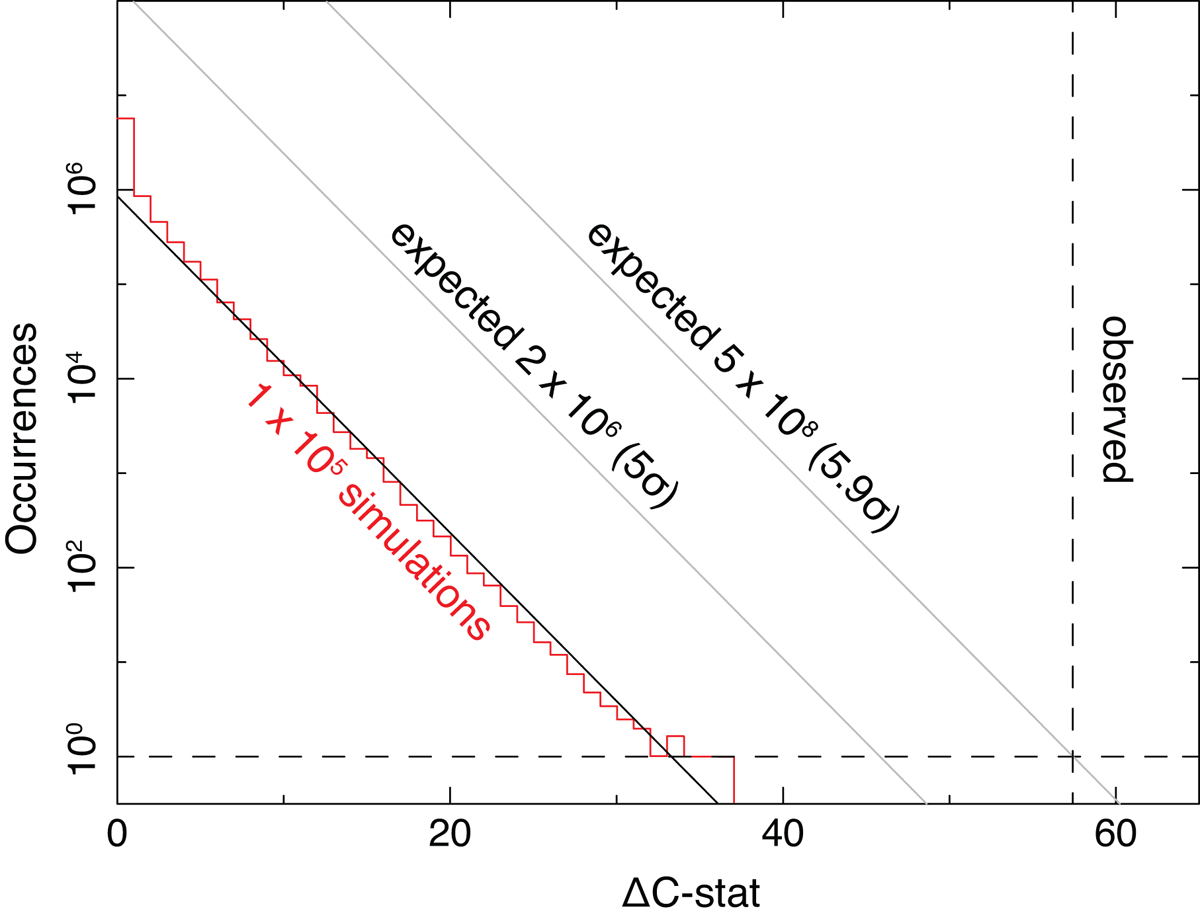
Fig. A.1.
Download original image
Histogram of 1 × 10⁵ runs of the Monto Carlo simulation of the NGC 5548 spectrum. The thick black line represents the corresponding power-law fit of the histogram, and the thin black lines show the expected results of 2 × 10⁶ and 5 × 10⁸ simulations. The vertical dashed line marks the observed ΔC-stat = 57 derived with the scan on the observed data using a Gaussian line with σ= 1000 km s−1.
Current usage metrics show cumulative count of Article Views (full-text article views including HTML views, PDF and ePub downloads, according to the available data) and Abstracts Views on Vision4Press platform.
Data correspond to usage on the plateform after 2015. The current usage metrics is available 48-96 hours after online publication and is updated daily on week days.
Initial download of the metrics may take a while.