Fig. 6.
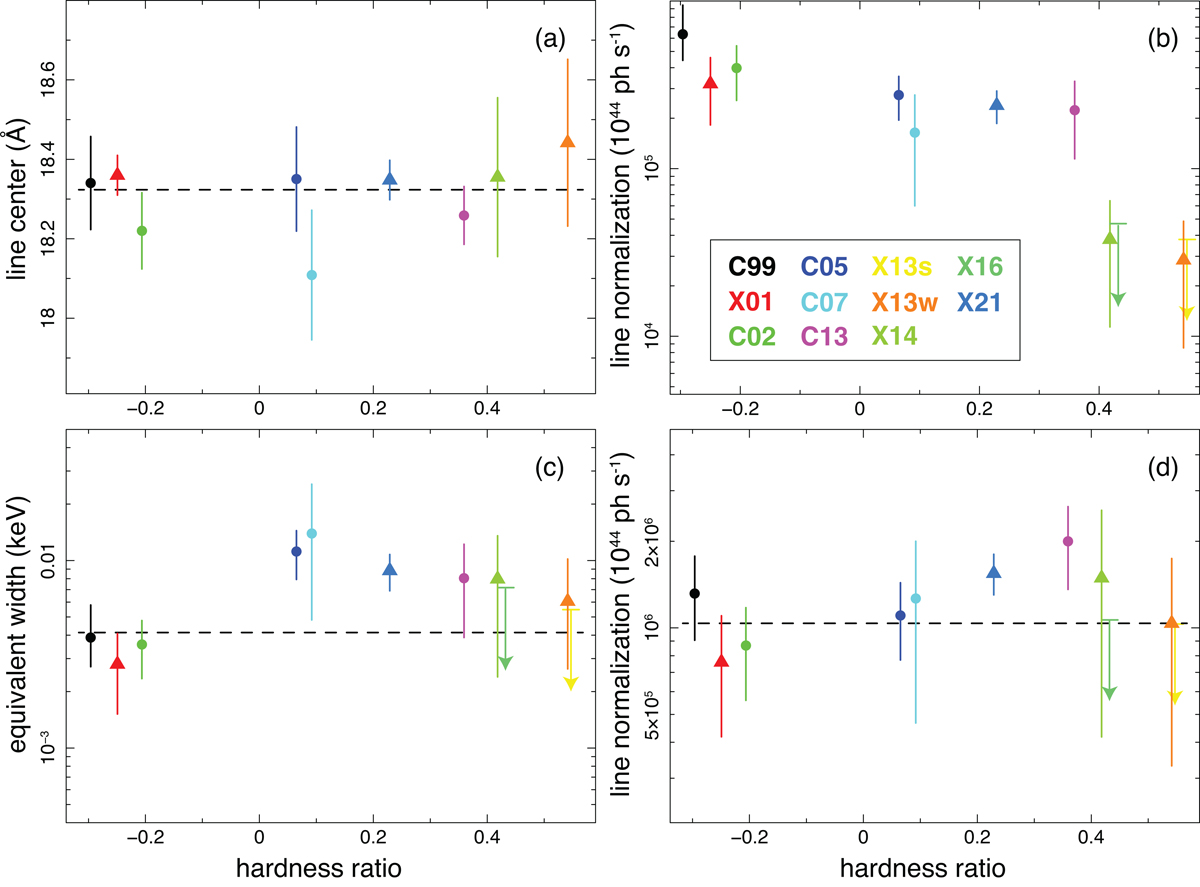
Download original image
Variation of the observed excess feature as a function of the average hardness ratio (H − S)/(H + S) (see Sect. 2.5). Panels a–d: variations of the central wavelength of the G1 component described in Sect. 2.5, the total G1 + G2 normalization assuming unabsorbed Gaussian components, the total equivalent width, and total normalization assuming absorption. The vertical lines in (a), (b), and (d) show the fits with a constant model.
Current usage metrics show cumulative count of Article Views (full-text article views including HTML views, PDF and ePub downloads, according to the available data) and Abstracts Views on Vision4Press platform.
Data correspond to usage on the plateform after 2015. The current usage metrics is available 48-96 hours after online publication and is updated daily on week days.
Initial download of the metrics may take a while.