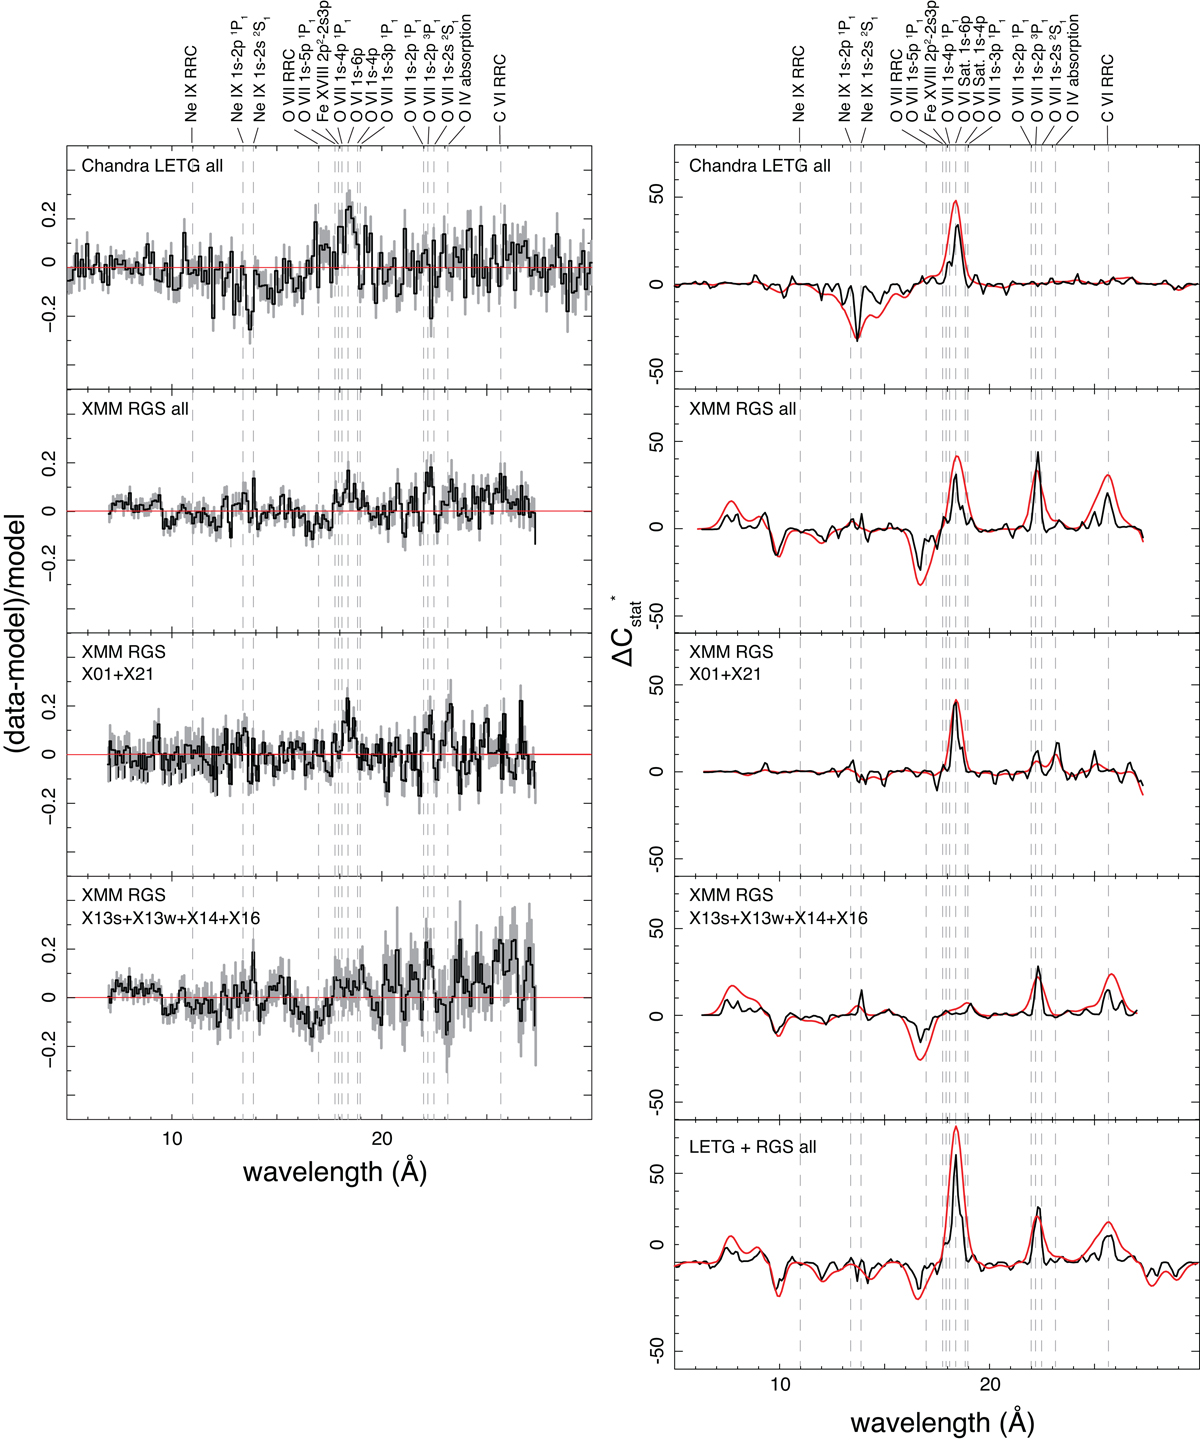
Fig. 2.
Download original image
Stacked residuals with respect to the baseline fit (left), and the Gaussian line scan performed on the data (right). In the panel on the right, the results for two different line widths σ = 1000 km s−1 and 4000 km s−1 are shown in black and red, respectively. Notable transitions relevant for the potential features in the stacked residuals are marked with vertical dashed lines. The wavelengths of the transitions are set to the AGN restframe.
Current usage metrics show cumulative count of Article Views (full-text article views including HTML views, PDF and ePub downloads, according to the available data) and Abstracts Views on Vision4Press platform.
Data correspond to usage on the plateform after 2015. The current usage metrics is available 48-96 hours after online publication and is updated daily on week days.
Initial download of the metrics may take a while.