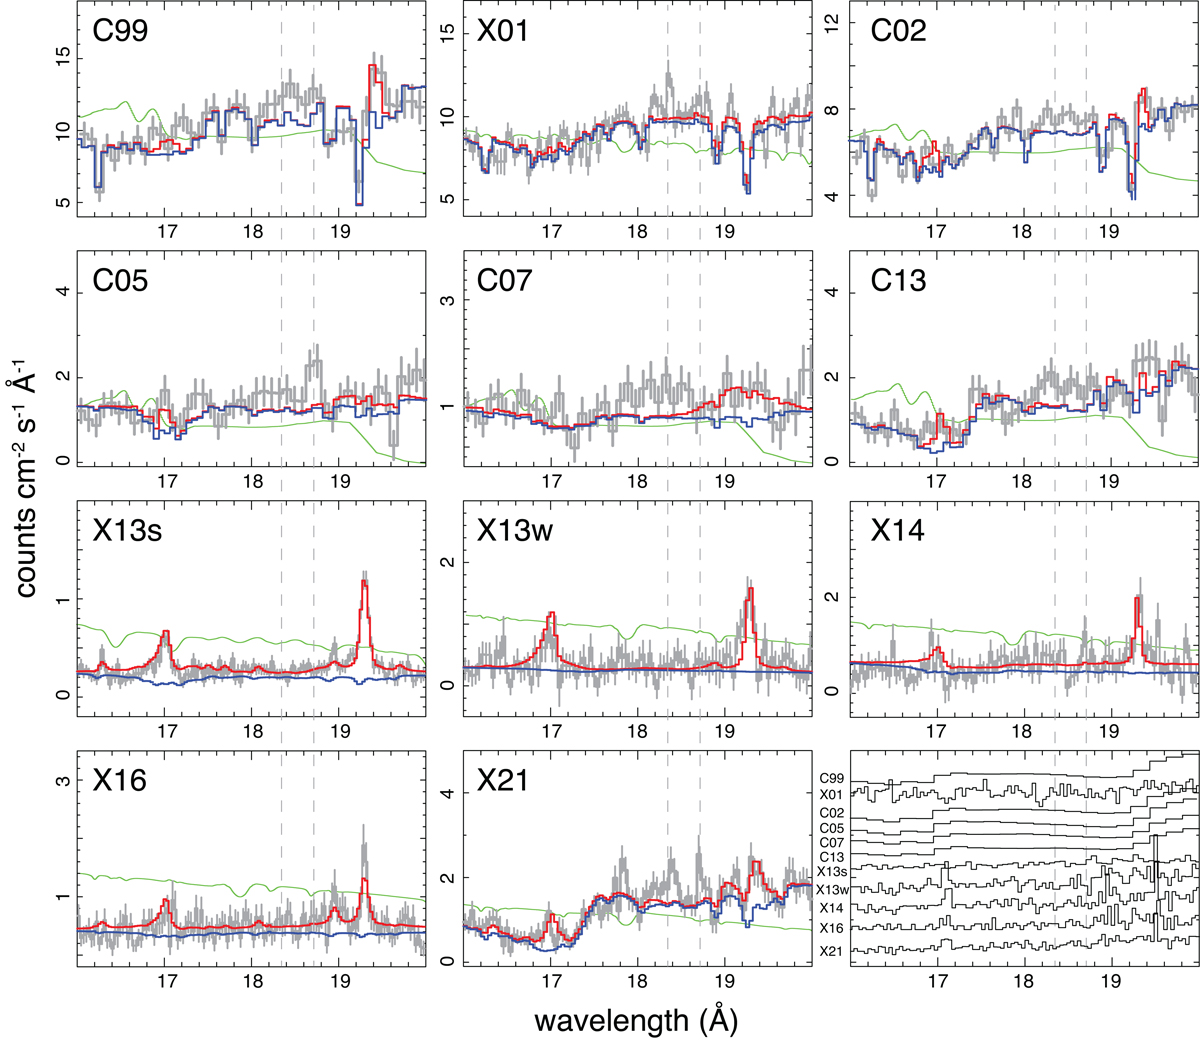
Fig. 1.
Download original image
X-ray grating spectra of NGC 5548 in the 16−20 Å band. All spectra are shown in the observed frame. The best-fit baseline models (described in Sect. 2.2) are shown in red. The baseline models excluding the emission pion components are plotted in blue. The thin green curves show the instrumental effective areas in arbitrary units. The corresponding background spectra are displayed in the bottom right panel. All background data are scaled for clarity. The vertical dashed lines mark the central wavelengths of the two possible peaks, 18.35 Å and 18.72 Å, seen in the X21 spectra (see Sect. 2.5 for details).
Current usage metrics show cumulative count of Article Views (full-text article views including HTML views, PDF and ePub downloads, according to the available data) and Abstracts Views on Vision4Press platform.
Data correspond to usage on the plateform after 2015. The current usage metrics is available 48-96 hours after online publication and is updated daily on week days.
Initial download of the metrics may take a while.