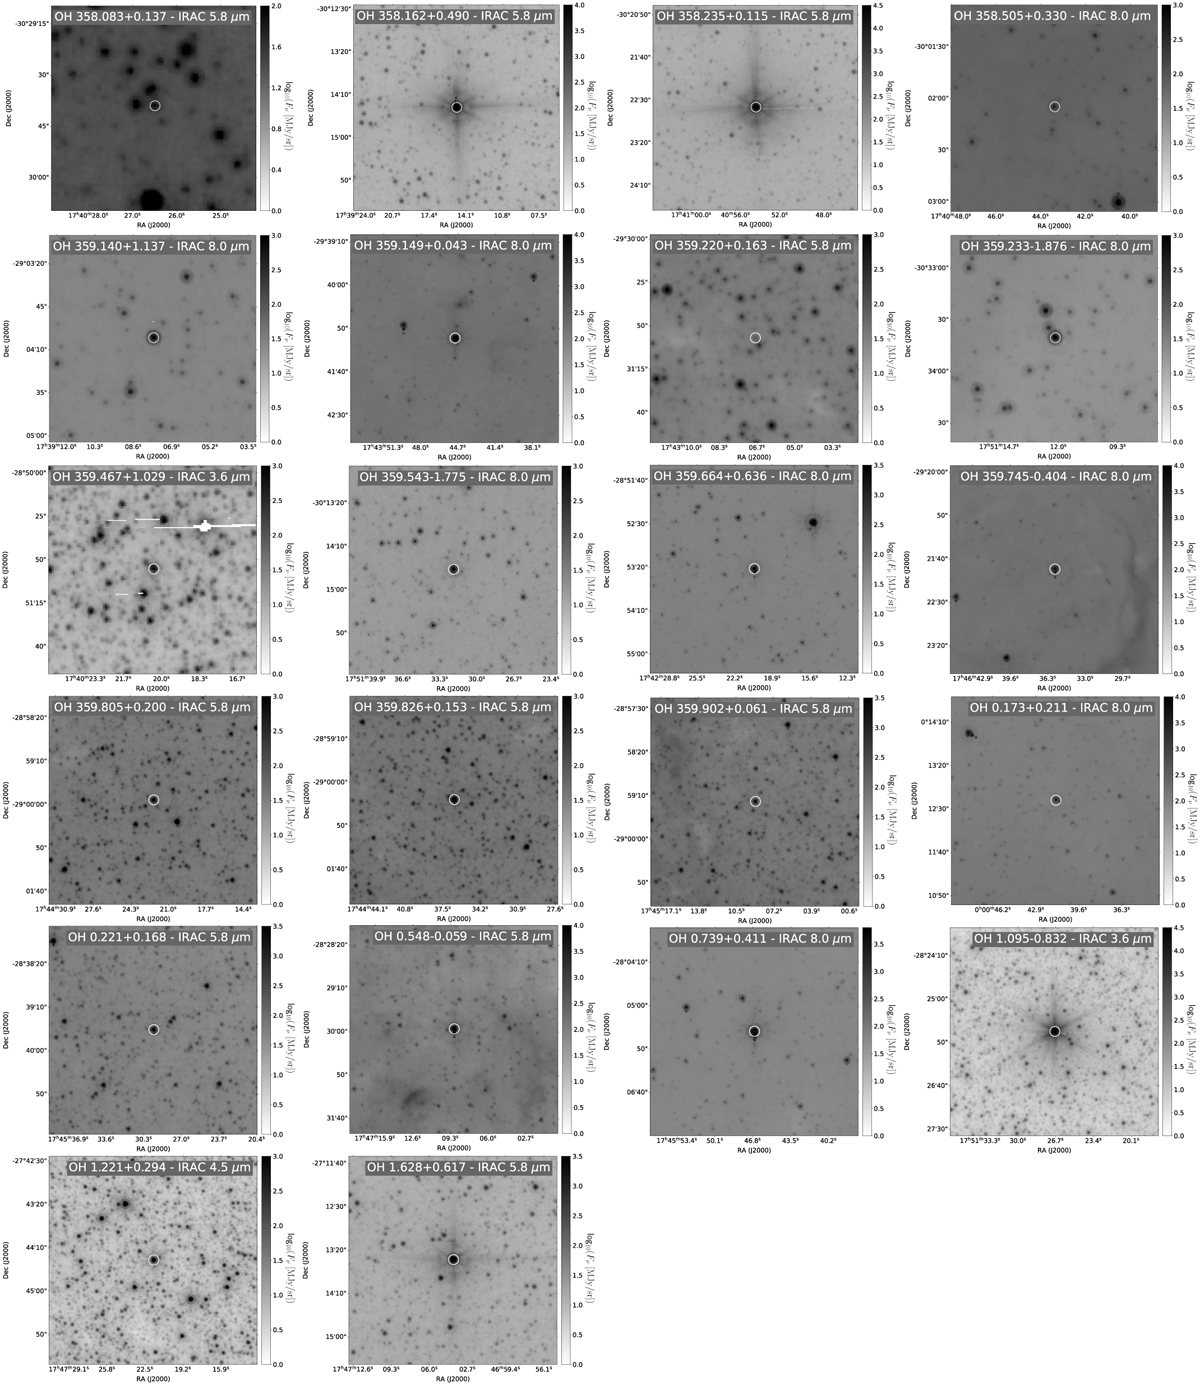
Fig. A.4
Download original image
Central position of the 13CO(J = 3–2) brightness distribution (marked with a white circle) on a Spitzer IRAC 3.6, 4.5, 5.8, or 8.0 µm image [for OH0.173+0.211 the position of the 12CO(J = 2–1) brightness distribution is used, and for OH359.149+0.043 the position of the 324 GHz continuum peak is used]. The size of the CO line brightness distribution is significantly smaller than the white circle in all cases.
Current usage metrics show cumulative count of Article Views (full-text article views including HTML views, PDF and ePub downloads, according to the available data) and Abstracts Views on Vision4Press platform.
Data correspond to usage on the plateform after 2015. The current usage metrics is available 48-96 hours after online publication and is updated daily on week days.
Initial download of the metrics may take a while.