Fig. A.1
Download original image
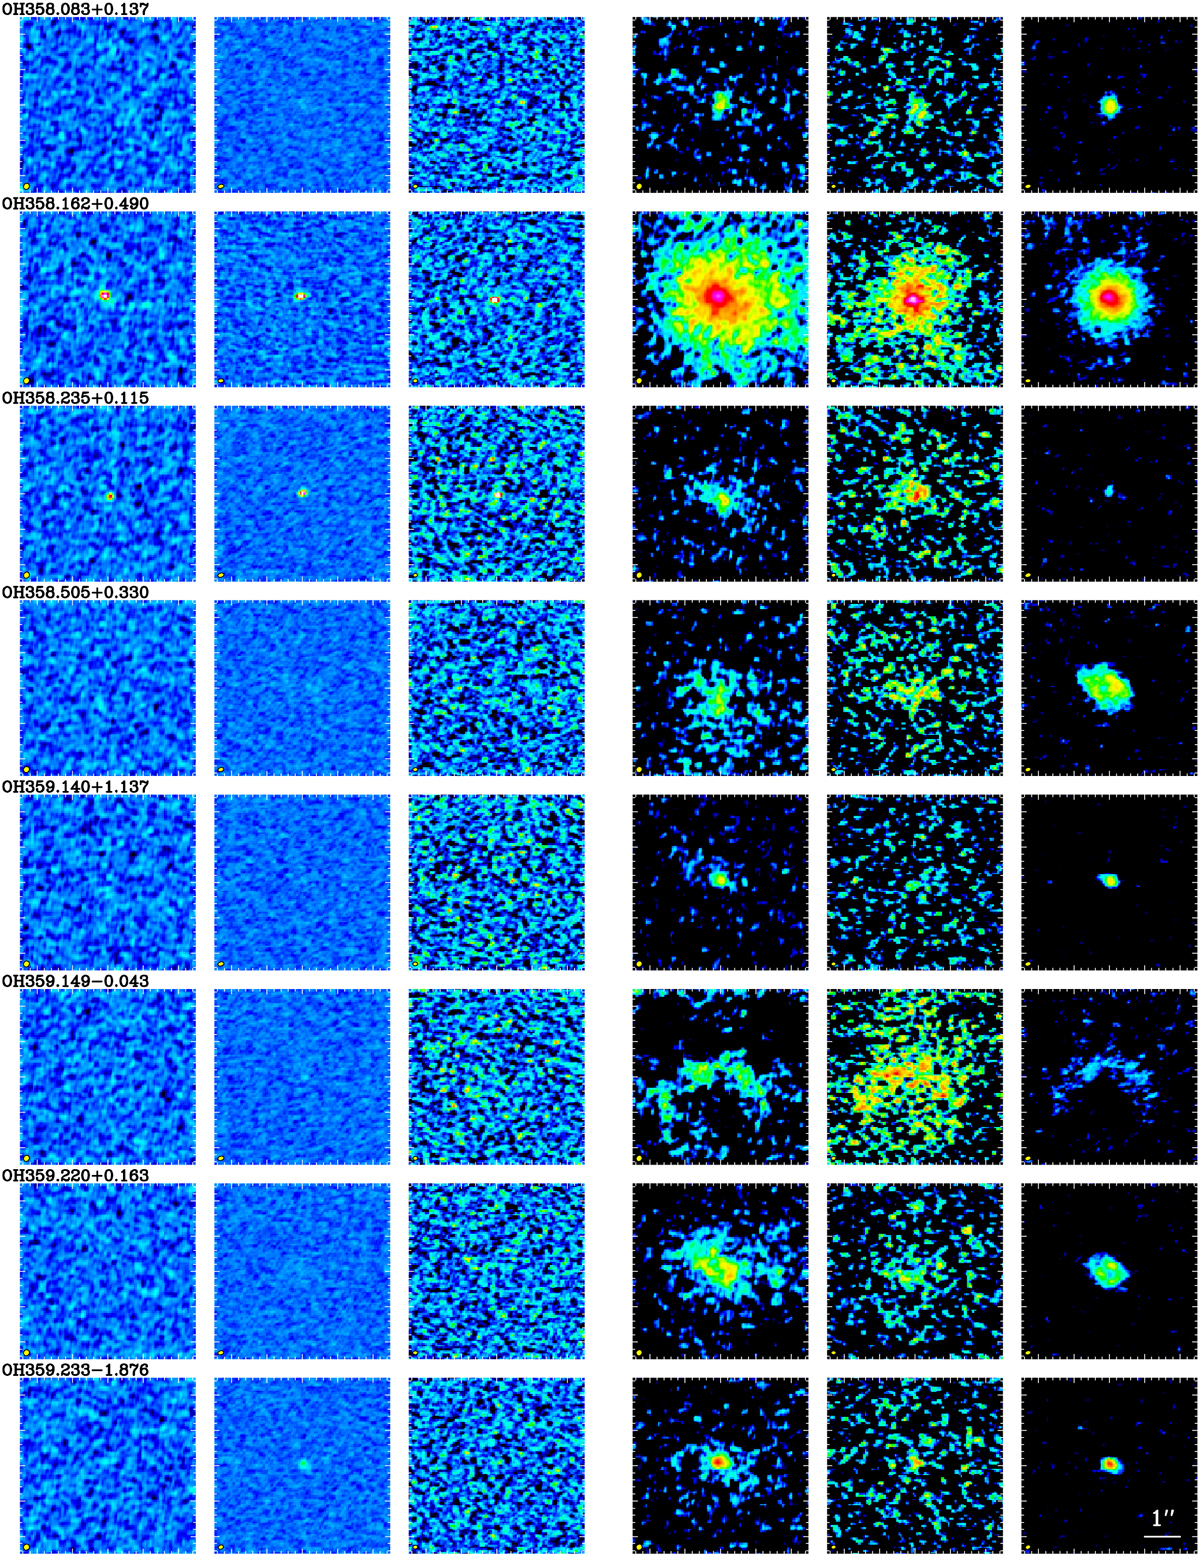
Continuum images at 222, 324, and 339 GHz in the 1st, 2nd, and 3rd column, respectively. The 12CO(J = 2–1), 12CO(J = 3–2), and 13CO(J = 3–2) brightness distributions integrated over the velocity range of the line in the 4th, 5th, and 6th column, respectively. Logarithmic scales are used in order to have the same scale for all objects. The image sizes are 5″ × 5″. The synthesised beams are shown in the lower left corner of each panel.
Current usage metrics show cumulative count of Article Views (full-text article views including HTML views, PDF and ePub downloads, according to the available data) and Abstracts Views on Vision4Press platform.
Data correspond to usage on the plateform after 2015. The current usage metrics is available 48-96 hours after online publication and is updated daily on week days.
Initial download of the metrics may take a while.