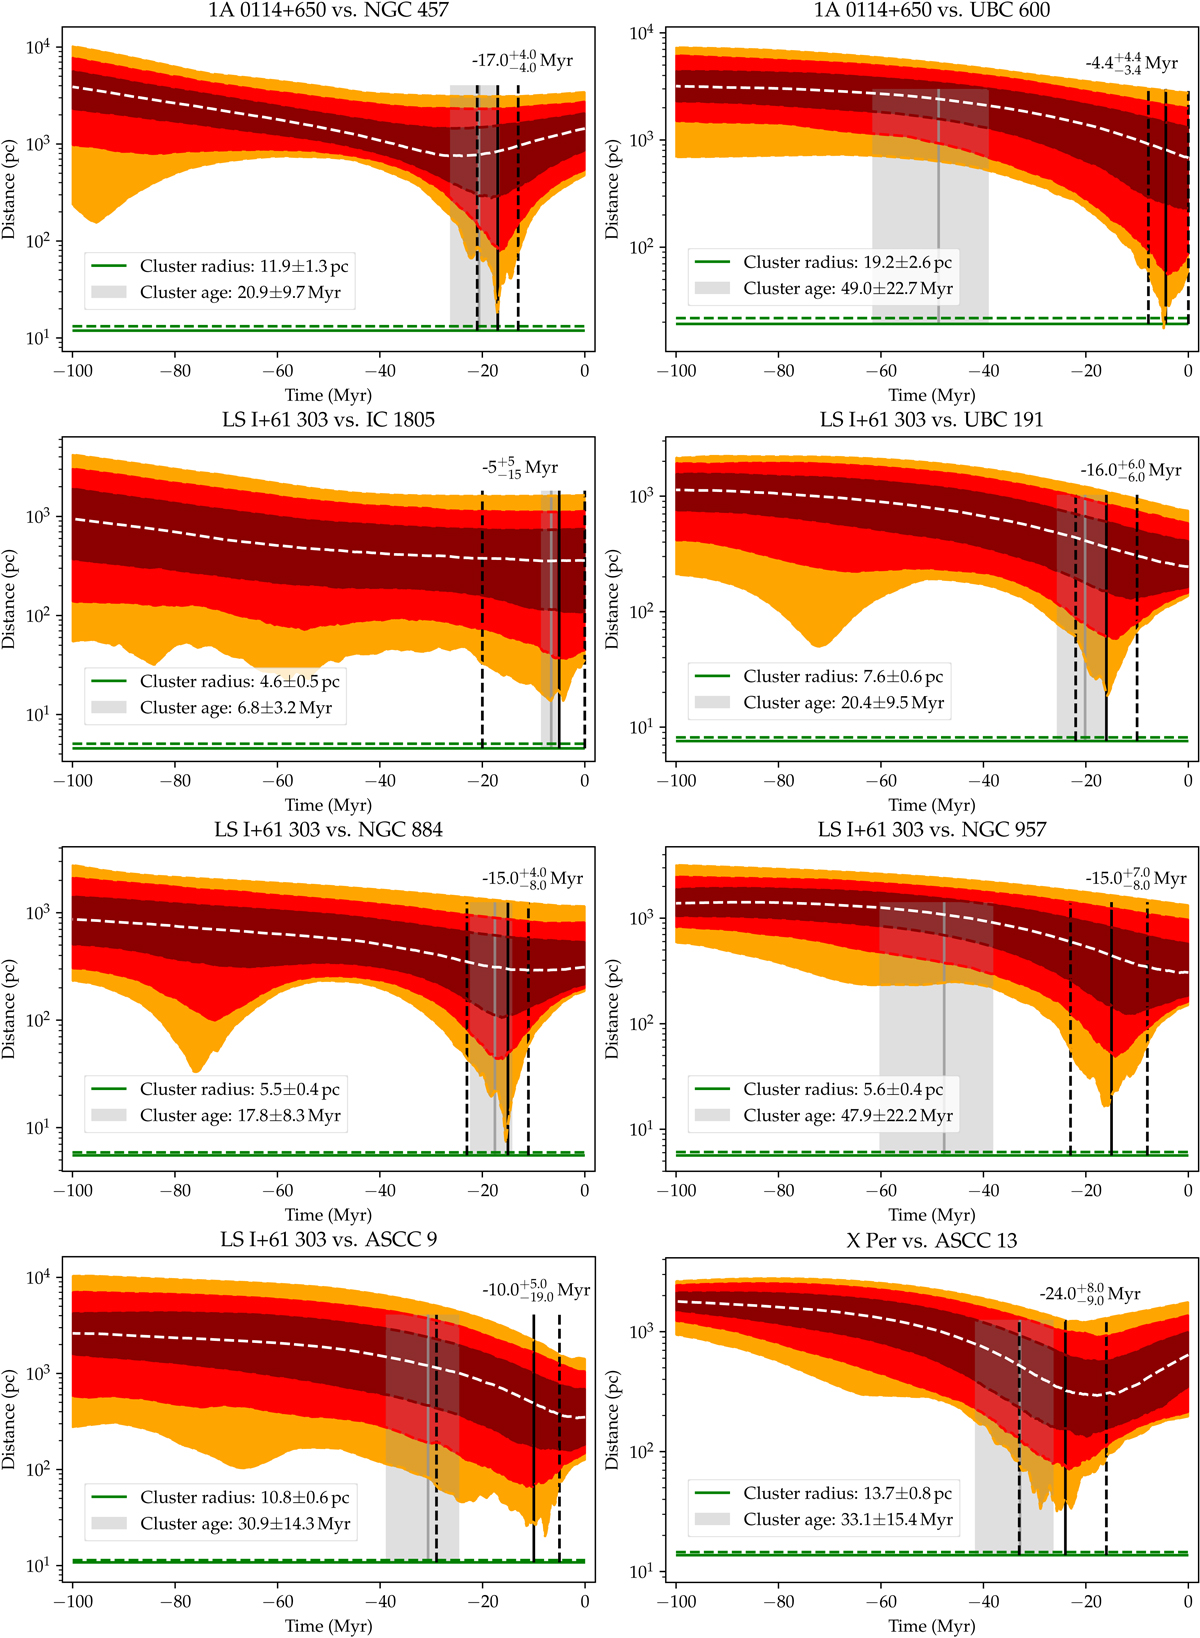
Fig. A.2.
Download original image
Time-distance histograms of encounter candidates between HMXBs and open clusters in the past 100 Myr. Dotted white lines represent the median distance, and the 1 to 3σ intervals are represented from dark red, to red, to orange. In green is indicated the physical radius of the clusters computed from their extension in the plane of the sky and their parallax. Their age range obtained through isochrone fitting is indicated in grey. The black vertical plain and dotted lines provide our estimation of the age since supernova in each binary-cluster encounter candidate.
Current usage metrics show cumulative count of Article Views (full-text article views including HTML views, PDF and ePub downloads, according to the available data) and Abstracts Views on Vision4Press platform.
Data correspond to usage on the plateform after 2015. The current usage metrics is available 48-96 hours after online publication and is updated daily on week days.
Initial download of the metrics may take a while.